
Among the foundational tools in technical analysis, trendlines and channels occupy a central role in how traders interpret price behavior in the forex market. They are, at their core, visual representations of directional movement — simple lines that, when drawn correctly, can offer deep insight into market psychology, momentum, and potential turning points. Yet despite their apparent simplicity, many traders misuse them, drawing arbitrary lines that fail to capture the actual structure of price action.
In forex, where price dynamics are influenced by macroeconomic cycles, central bank policy, and geopolitical shifts, trendlines and channels become more than just tools — they become frameworks. They help traders move from reactive to proactive thinking, by providing a contextual backdrop to each candle, each retracement, and each breakout. A trendline is not just a line connecting two lows or highs; it is a visual reflection of order flow and trader behavior over time.
Channels take this idea further, enclosing price action within a structure that not only highlights the trend, but also its rhythm — the oscillation between support and resistance, the compression before a breakout, and the failure patterns that precede reversals. Channels allow traders to gauge volatility, assess risk-to-reward potential, and build trade setups with greater clarity.
This guide explores the depth of both tools, breaking down their technical construction, psychological underpinnings, and practical applications. We will explore how trendlines are drawn across different timeframes, how they evolve with market structure, and how to integrate them with confirmation tools. We’ll dive into price channels — their types, strengths, and weaknesses — and the strategies that emerge when channels hold versus when they break.
Whether you're a price action purist or a trader who blends discretionary and algorithmic methods, trendlines and channels can serve as the scaffolding of your analysis. But only if used with intention, precision, and awareness of their limitations. In this comprehensive article, we aim to go beyond the textbook definitions and explore how these tools behave in real forex markets — imperfect, volatile, yet rich in structure.
What Are Trendlines?
Concept and Purpose
Trendlines are straight lines drawn on a price chart that connect a series of price points and help to visually represent the prevailing direction of the market. In forex trading, where price fluctuations are often rapid and complex, trendlines provide a simplified lens through which traders can observe directional bias. They are drawn either as upward-sloping (bullish) or downward-sloping (bearish), depending on whether they connect higher lows or lower highs.
At the most basic level, an upward trendline is formed by connecting two or more rising swing lows, indicating persistent buying pressure. A downward trendline connects falling swing highs, highlighting sustained selling pressure. These lines do not just illustrate price direction — they establish a boundary of expected behavior. As long as price respects the trendline, the underlying trend is presumed intact. Once broken, a reevaluation is often necessary, as the market may be transitioning into a different phase.
In practical terms, trendlines are used to identify entry points, manage trades, and recognize when a trend is weakening or reversing. They offer a roadmap, showing where price has been respecting structure and where it might find dynamic support or resistance in the future. More importantly, they offer consistency — a visual tool traders can use regardless of time horizon, asset class, or strategy.
Psychology Behind Trendlines
Trendlines may appear to be mechanical constructs, but their formation is deeply psychological. Each touch of a trendline represents a consensus among market participants: a recognition of value, a collective decision to continue with the prevailing trend. When price bounces from an upward trendline, it reflects renewed confidence in the bullish outlook. When price breaks below a rising trendline, it signals a possible shift in sentiment — buyers are either exhausted or have lost conviction.
This makes trendlines self-reinforcing to a degree. The more often a trendline is respected, the more visible it becomes, and the more traders build their decisions around it. This visibility feeds back into the market, creating clusters of orders near the trendline — entries, stop-losses, and take-profits — which can amplify its strength or trigger sharp moves when it fails.
However, this visibility can also make trendlines vulnerable to manipulation. Smart money knows where retail traders anchor their positions. As a result, price may intentionally overshoot a trendline to trigger stop orders before reverting. This dynamic underscores the importance of using trendlines as zones, not precise levels, and combining them with additional context such as volume, volatility, and market sentiment.
In essence, trendlines reflect not just where the market is going, but how traders feel about it. They chart belief, fear, and commitment — and like all sentiment-driven tools, they work best when interpreted with nuance, not blind adherence.
How to Draw a Trendline Correctly
Bullish vs Bearish Trendlines
Understanding the direction of the market is crucial when drawing trendlines. Here’s how to approach both types:
- Bullish Trendline: Connect two or more ascending swing lows. The line should slope upward and act as dynamic support.
- Bearish Trendline: Connect two or more descending swing highs. The line should slope downward and act as dynamic resistance.
- At Least Two Points: A valid trendline requires at least two anchor points. A third touch confirms its relevance.
- Steepness Matters: Very steep trendlines often break quickly. A moderate angle suggests a more sustainable trend.
- Draw With Intent: Don’t force a line to fit the chart. Draw what the market gives you, not what you want to see.
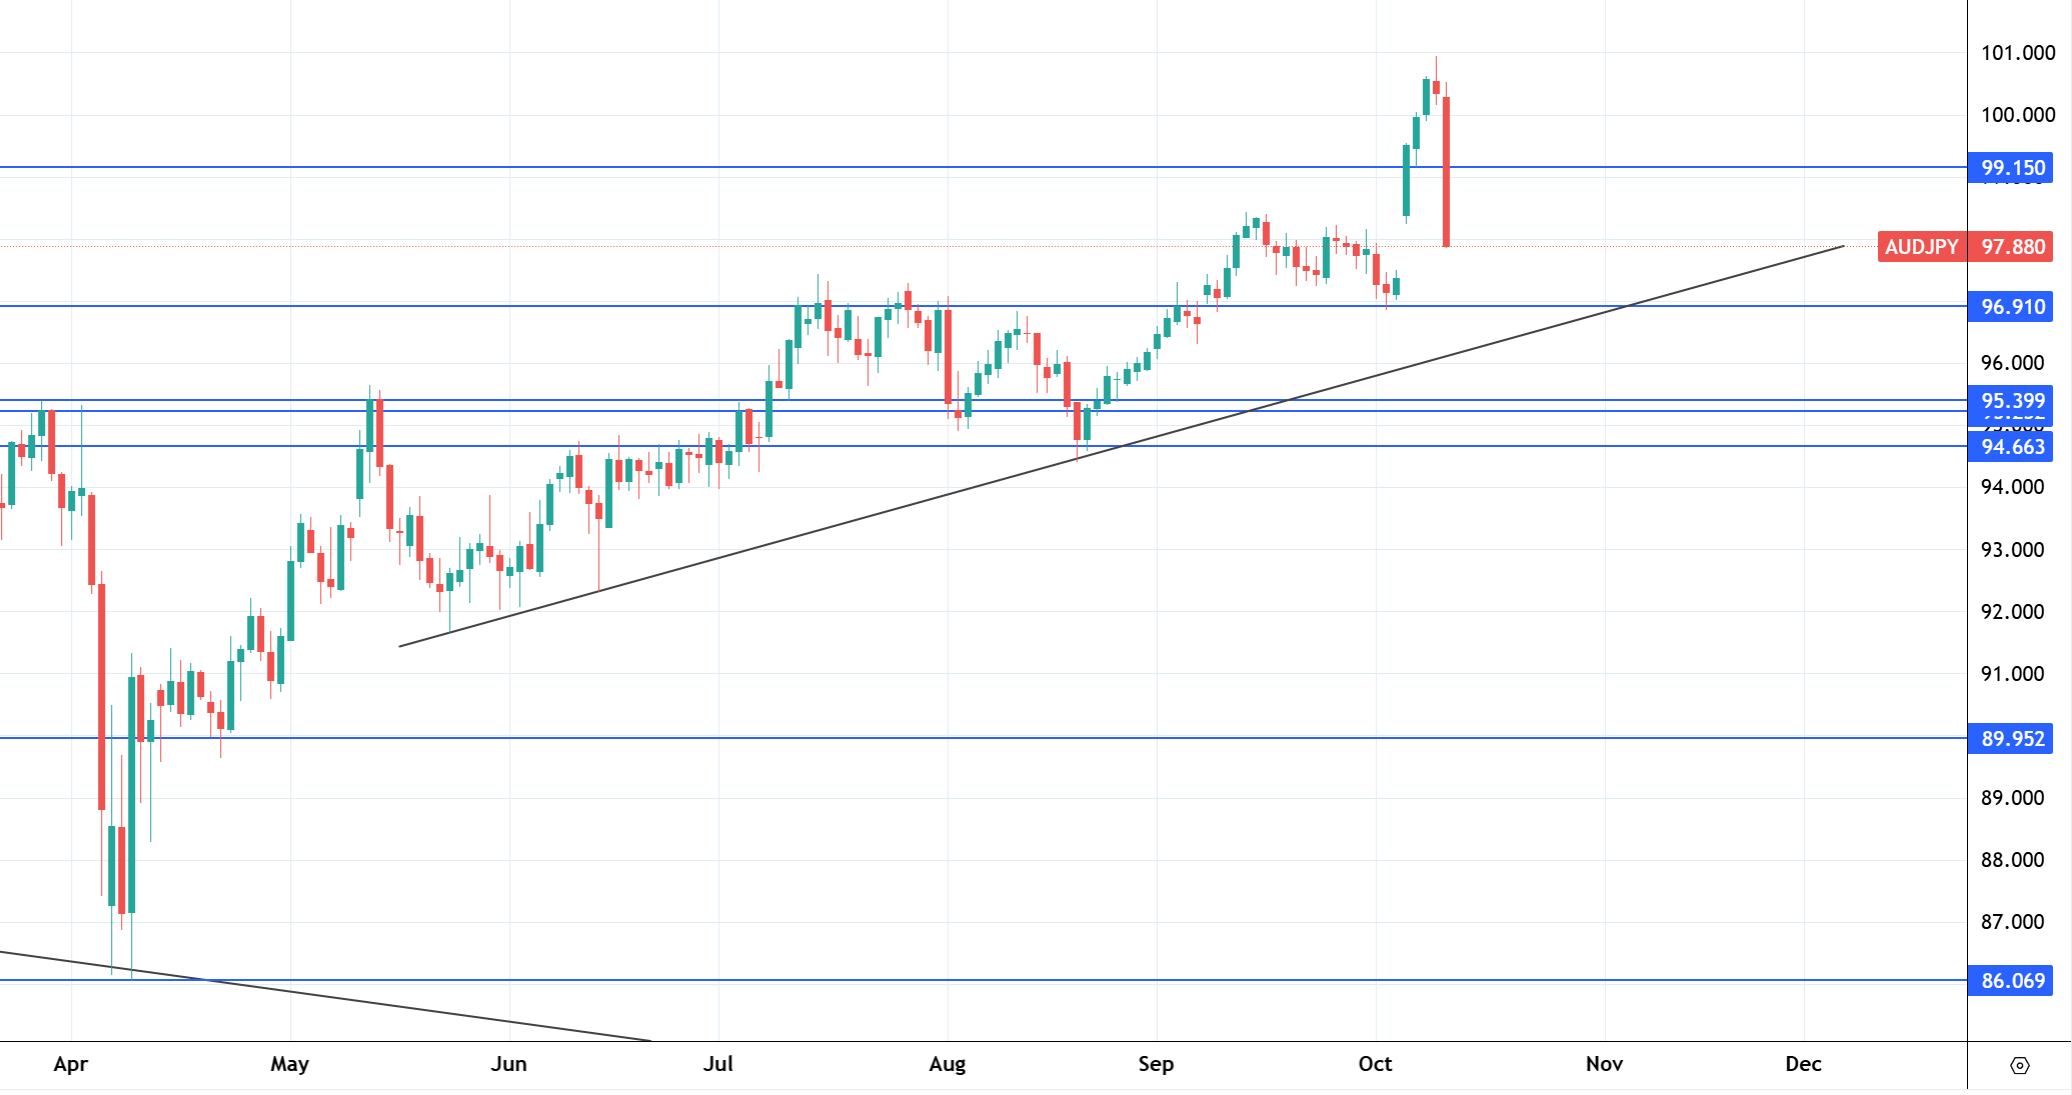
AUD/JPY daily chart with a lower trendline, Source: TradingView
Timeframe Considerations
The timeframe you choose significantly impacts the strength and utility of your trendlines:
- Higher Timeframes First: Begin with weekly and daily charts to identify major structural trends.
- Drill Down for Precision: Move to 4H or 1H charts to refine entries and see short-term reactions to key lines.
- Match Trendline to Strategy: Swing traders may use 1D and 4H, while scalpers rely on 15M and 5M charts.
- Don’t Mix Signals: A trendline on the 5M chart has little significance on a 1D setup. Maintain context.
- Consistency is Key: Keep trendline logic aligned across your multi-timeframe analysis to avoid conflicts.
Wicks vs Bodies
One common debate is whether to draw trendlines using candle wicks or the bodies (closing prices):
- Use Wicks for Extremes: Wicks represent the full range of market movement and capture price rejection.
- Use Bodies for Consensus: Bodies reflect where price settled and may be more reliable in volatile sessions.
- Combine Both: Drawing a zone that spans both wicks and closes allows for flexibility and realism.
- Context Matters: In trending markets, wicks can provide sharper entries. In consolidations, bodies offer more stability.
- Stick to One Method Per Trendline: Mixing wicks and bodies in the same line often results in poor consistency.
How to Use Trendlines in Trading
Entry and Exit Strategies
Trendlines can serve as both triggers and filters for trade execution. Here’s how to use them effectively:
- Bounce Entry: Buy near an ascending trendline or sell near a descending one after a clear rejection candle.
- Trend Continuation: Wait for price to pull back to the trendline, then enter in the direction of the trend after confirmation.
- Exit on Touch: Use the opposing trendline or channel boundary as a take-profit zone.
- Invalidation: Place stop-loss orders just beyond the trendline to limit risk on failed setups.
- Trendline Break as Signal: A clean break of the trendline can be used as an exit signal or reversal entry.
Support and Resistance Role
Trendlines act as diagonal versions of support and resistance and follow similar principles:
- Dynamic Support: In an uptrend, the trendline provides a rising floor where buyers may step in.
- Dynamic Resistance: In a downtrend, the trendline acts as a descending ceiling where sellers emerge.
- Multiple Touches: The more times price bounces from a trendline, the more trustworthy it becomes.
- Psychological Anchor: Traders remember and respond to well-respected trendlines over time.
- Reversal Signals: When price fails to reach a trendline after a bounce, it may indicate weakening momentum.
Break and Retest Technique
One of the most powerful uses of trendlines is trading breakouts with confirmation:
- Initial Break: Wait for a strong candle to close beyond the trendline — not just a wick.
- Retest Entry: When price returns to test the broken trendline, look for confirmation candles (e.g. engulfing, pin bar).
- Structure Shift: Combine the break with a change in market structure (e.g. lower high in an uptrend).
- Risk Control: Place stops beyond the retest point and target the next key level.
- Volume Confirmation: Breakouts with high volume tend to be more reliable than low-volume ones.
What Are Price Channels?
Types of Channels
Price channels are formed by drawing a pair of parallel trendlines that contain price movement. Here are the most common types:
- Ascending Channel: Both trendlines slope upward, connecting higher highs and higher lows — signaling a bullish trend.
- Descending Channel: Both lines slope downward, containing lower highs and lower lows — indicating a bearish trend.
- Horizontal Channel: Also known as a range or sideways channel, where both boundaries are flat and price oscillates between them.
- Wide vs Narrow: Wide channels offer more swing potential; narrow ones may indicate compression before a breakout.
- Manual vs Automated: Channels can be hand-drawn or identified via tools like regression channels or Donchian bands.
Structure and Components
To understand channels, it’s important to know their structural elements:
- Upper Boundary: Acts as dynamic resistance, typically drawn across swing highs.
- Lower Boundary: Acts as dynamic support, drawn across swing lows.
- Channel Width: The vertical distance between the two lines — useful for measuring volatility and projecting targets.
- Midline: Optional, but often used to assess equilibrium or midpoint reactions within the channel.
- Number of Touches: At least two touches on each side confirm a valid channel; more touches add strength.
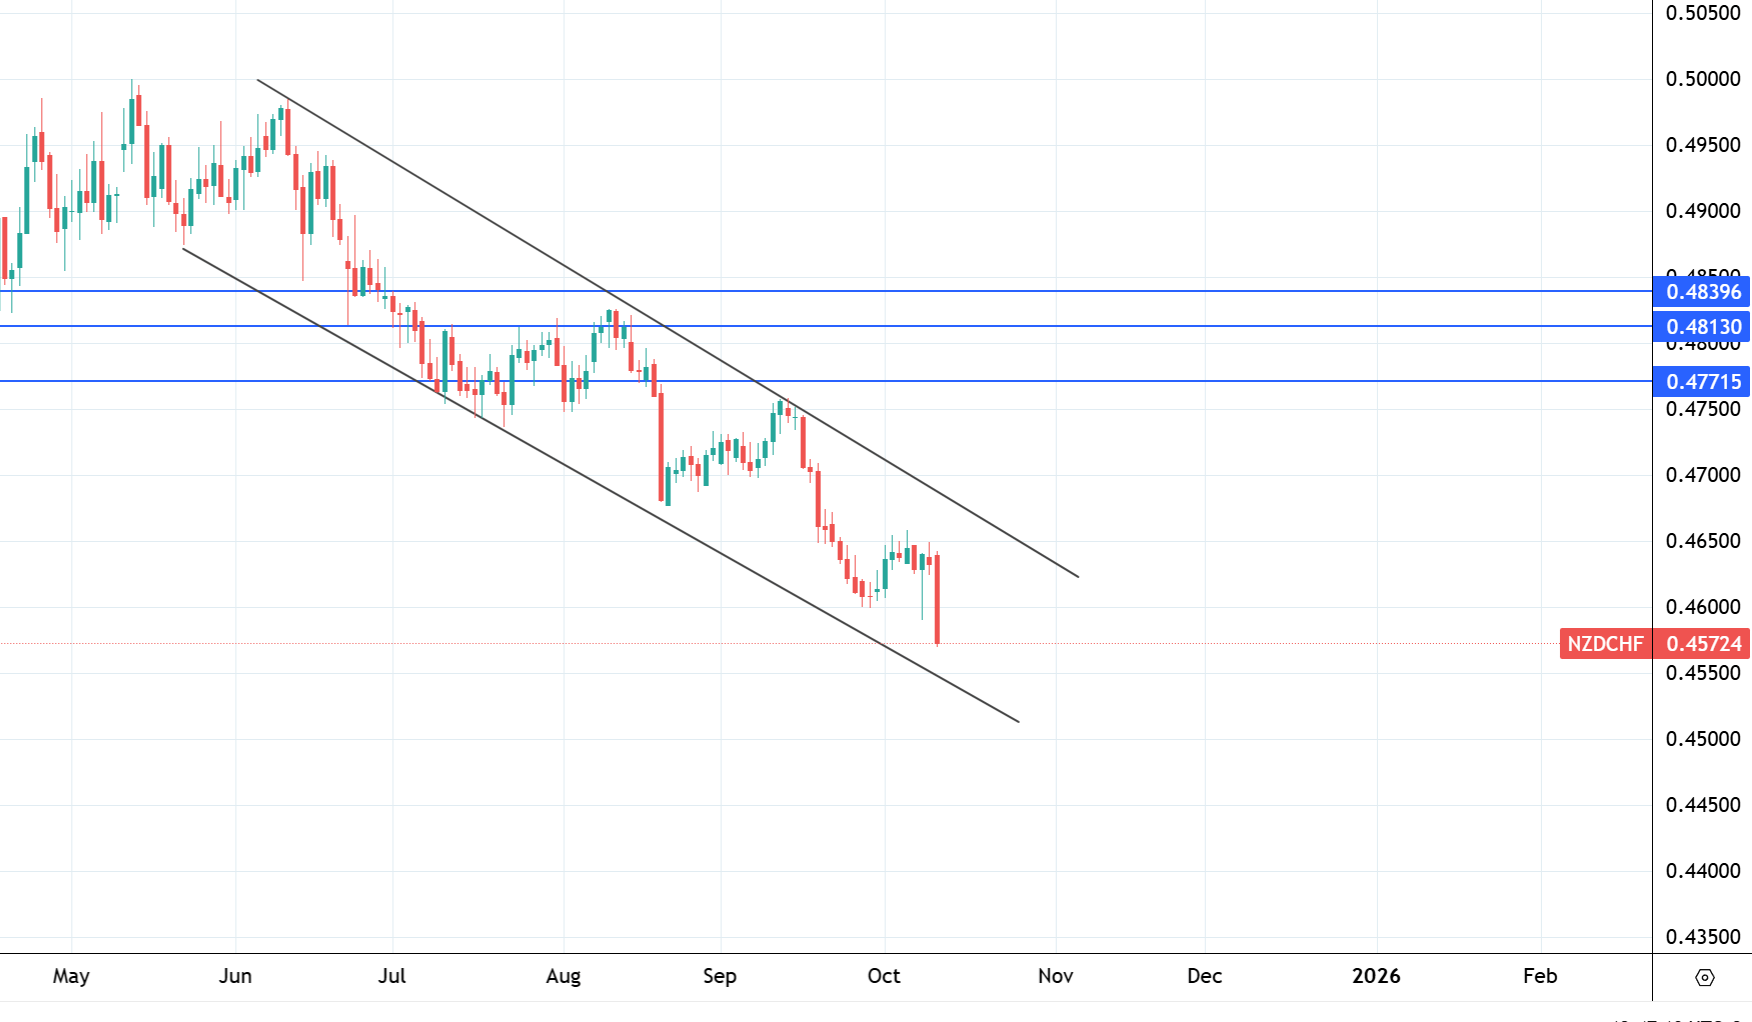
NZD/CHF with a bearish channel, Source: TradingView
Trendlines vs Channels
While similar in form, trendlines and channels serve different analytical purposes. Key differences include:
- Single vs Dual Lines: A trendline is a single line; a channel consists of two parallel lines enclosing price.
- Support Only vs Support/Resistance: Trendlines act mainly as support/resistance in one direction; channels define both boundaries.
- Directional Confirmation: Channels make trends more visible and offer clearer visual cues for entries and exits.
- Target Projection: Channels can be used to set price targets based on the distance between boundaries.
- False Break Filtering: Channels can help identify fakeouts more easily by providing context from both sides.
How to Draw a Channel in Forex
Parallel Line Technique
Drawing channels requires a blend of precision and flexibility. Here’s how to construct one correctly:
- Start with the Trendline: Identify the dominant trend and draw a line connecting two or more swing lows (uptrend) or highs (downtrend).
- Clone the Line: Create a parallel copy of the trendline and place it on the opposite side of the price action to form the channel.
- Anchor the Parallel: Align the cloned line with the first significant swing on the opposite side of the trend.
- Adjust if Needed: Fine-tune the parallel to capture most price touches without forcing a perfect fit.
- Validate with Price Action: Ensure that price respects both boundaries with multiple touches — at least two on each side.
Common Mistakes
Misusing channels can lead to false signals and poor setups. Avoid these frequent errors:
- Forcing Symmetry: Not all markets move in perfect parallel lines. Don’t distort the structure just to “make it fit.”
- Insufficient Touches: Channels need confirmation. Drawing one with only a single anchor per side weakens reliability.
- Overlooking Timeframe Context: A channel on the 15M chart may be irrelevant when trading the daily trend.
- Ignoring Breakouts: Channels eventually break — don’t hold onto the structure if price invalidates it.
- Neglecting Volatility: During news events, channels may become distorted or temporarily irrelevant.
Confirmation with Indicators
Indicators can strengthen your confidence in a drawn channel. Use them as support tools:
- Moving Averages: A channel aligned with the 20 or 50 EMA often reflects a trending market with strong momentum.
- Volume Profile: High-volume areas near channel boundaries can validate reaction zones.
- RSI or Stochastic: Overbought/oversold readings at channel edges can signal reversals or breakouts.
- Bollinger Bands: Channels that overlap with Bollinger extremes indicate significant boundaries.
- MACD Divergence: Divergences at channel extremes may warn of a pending trend change or breakout.
How to Trade with Trendlines and Channels
Entry Strategies Using Trendlines
Trendlines are not just visual aids—they are active components of a trading strategy. Here are common ways to enter trades using trendlines:
- Bounce Trades: Buy at upward trendline support or sell at downward trendline resistance after a bounce is confirmed.
- Breakouts: Enter after price breaks through a trendline with strong momentum, ideally confirmed by volume or a candlestick pattern.
- Pullback to Trendline: Wait for a breakout, then enter on a pullback retest of the broken trendline (now acting as support/resistance).
- Confluence Setups: Combine trendlines with Fibonacci levels or moving averages for layered confirmation.
- Multi-Timeframe Entry: Use higher timeframe trendlines for context, then lower timeframe trendlines for precision entries.
Entry Strategies Using Channels
Channels allow for a range-bound trading style or breakout anticipation. Here’s how to use them effectively:
- Buy at Lower Boundary: Go long when price reaches the lower boundary of an upward channel with confirmation.
- Sell at Upper Boundary: Enter short near the upper boundary of a descending or sideways channel.
- Channel Breakout: Trade the breakout direction when price breaches the channel, ideally with a retest and strong candle close.
- Ride the Channel: Trend-followers can enter mid-channel after confirming the overall momentum and alignment with indicators.
- Fade Extremes: Contrarians may trade against the outer edges of the channel, using tight stops and strong reversal signals.
Risk Management Tactics
Trendline and channel trades can fail. Proper risk management is non-negotiable:
- Place Stop Loss Beyond Structure: For trendlines, set stops just beyond the line. For channels, place stops beyond the opposite boundary.
- Use ATR for Volatility-Based Stops: Set stop-losses using Average True Range to accommodate natural volatility swings.
- Fixed % Risk: Risk no more than 1–2% of your capital per trade to survive drawdowns and stay in the game.
- Position Sizing: Adjust lot size based on distance between entry and stop-loss to keep risk consistent.
- Avoid Overtrading the Same Line: Trendlines can lose strength after multiple touches or failed bounces.
Take Profit and Exit Strategies
Having a plan for when to exit is just as important as the entry:
- Opposite Side of Channel: For channel trades, target the opposite boundary as the initial take-profit zone.
- Static Risk:Reward: Use fixed ratios like 2:1 or 3:1 to determine exit points based on your stop-loss size.
- Trailing Stop: Lock in gains as price moves in your favor using manual or ATR-based trailing stops.
- Time-Based Exits: Close trades after a specific time or session if price action stalls or becomes choppy.
- Divergence Signals: Exit if RSI or MACD shows divergence against your trade, even if the trendline holds.
Combining Tools and Price Action
The most reliable trades come from combining methods, not relying on a single line:
- Trendline + Candlestick Patterns: Look for pin bars, engulfing patterns, or inside bars bouncing off trendlines.
- Trendline + RSI: Confirm overbought or oversold conditions along the trend structure.
- Channel + Moving Averages: Use EMAs for trend confirmation when trading inside or around a channel.
- Channel + Volume: Watch for volume spikes on channel breaks to validate direction and strength.
- Multi-Indicator Confluence: Don’t hesitate to stack multiple tools—trendlines, indicators, and candlestick signals.
Conclusion
Trendlines and channels are foundational tools in technical analysis. When drawn and used correctly, they can help traders identify the direction of the market, find high-probability entry points, and set realistic targets. But like any tool, they require skill, patience, and an understanding of context to be used effectively.
Key Takeaways
Structure and Simplicity: Trendlines and channels offer a clean way to visualize market structure without overly relying on indicators.
Dynamic Levels: Unlike static support and resistance, trendlines evolve with price and help define moving zones of interest.
High Confluence Potential: These tools shine when combined with other methods like RSI, Fibonacci, price action, or volume.
Versatile Across Markets: Whether in forex, stocks, crypto, or indices, the principles of trendlines and channels remain consistent.
Subjective but Powerful: Drawing lines is part art, part science. With practice, they become a trader’s second nature.
Best Practices for Longevity
Always Validate with Price Action: Don’t trade a line simply because it’s drawn—wait for candles and confirmation.
Use Multi-Timeframe Analysis: What looks like a breakout on the 5-minute chart might be noise on the daily.
Practice Line Discipline: Avoid redrawing lines to force a fit. Let the market prove the line's validity.
Combine with Risk Management: Even the best lines fail. Pair every setup with a clear stop-loss and position size rule.
Document Your Trades: Keep a log of all trendline/channel-based trades to refine your accuracy over time.
Frequently Asked Questions
What’s the difference between a trendline and a channel?
A trendline connects swing highs or lows to define market direction. A channel includes a parallel line on the opposite side of price to form a “path” in which price tends to move. A trendline gives direction; a channel gives both direction and range.
How many points are needed to draw a valid trendline?
At minimum, two points are needed to draw a trendline, but three or more touches increase its reliability. The more confirmations a trendline has, the more traders are likely to respect it, making it more effective as a decision-making tool.
What happens when price breaks a trendline?
When price breaks a trendline with strength and volume, it may signal a reversal or a deeper correction. However, false breakouts are common, so traders often wait for a retest or use other indicators to confirm the break before trading it.
Can trendlines be used in sideways markets?
Trendlines are most useful in trending markets. In sideways conditions, horizontal support and resistance levels or channels are more appropriate. However, minor trendlines can still help identify micro-movements within a range.
Do professional traders rely on trendlines and channels?
Yes. Many institutional and professional traders use trendlines and channels—especially when trading price action—because they provide clean, visually intuitive structures that help interpret momentum, reversals, and breakout potential. These tools are timeless and universal.
Note: Any opinions expressed in this article are not to be considered investment advice and are solely those of the authors. Singapore Forex Club is not responsible for any financial decisions based on this article's contents. Readers may use this data for information and educational purposes only.


