Multiple Time Frame Analysis (MTFA) is the disciplined practice of reading a market through at least three lenses of time before risking any capital. Rather than treating a single chart as “the truth,” MTFA accepts that markets are fractal and that trends, pullbacks, consolidations, and breakouts exist simultaneously on different horizons. One chart conveys a story; several charts reveal the context, the subtext, and the timing. If single-time-frame trading is like looking through a keyhole, MTFA opens the door and turns on the lights.
Why is context so decisive? Most losses come from good ideas executed at the wrong moment or in the wrong direction relative to the dominant flow. A buy on a five-minute bullish pattern might still fail if the higher time frame downtrend is resuming. Likewise, a short taken during an intraday pullback can unravel if the daily impulse leg is accelerating. MTFA resolves this by assigning roles to each chart: the highest frame sets the directional bias, the mid frame maps structure and location (where price is within the larger move), and the lowest frame provides the precise trigger and risk placement.
This guide is intentionally practical. We will define clear time-frame stacks for different trading styles, offer step-by-step playbooks, explain how to integrate tools (price action, moving averages, RSI, MACD, Fibonacci, and volume proxies), and address risk management, execution checklists, and psychological considerations. You will also find common mistakes, debugging techniques, and case studies that illustrate how the same pair can look different—and tradable—for a scalper, a day trader, and a swing trader at the exact same moment. The goal is not to impress with complexity but to give you a repeatable, professional process you can adapt to your platform and routine.
What Is Multiple Time Frame Analysis?
At its core, MTFA is a conversation that occurs simultaneously at both the top-down and bottom-up levels, involving charts. The top-down path asks: what is the market trying to do on the highest relevant frame (trend, distribution, accumulation, range expansion), and where are the meaningful levels (swing highs/lows, value areas, prior day/week/month extremes)? The bottom-up path asks: given that higher-frame story, what exact lower-frame conditions would constitute a high-quality entry (pattern, momentum alignment, volatility contraction/expansion, liquidity sweep) with a definable stop and asymmetric reward?
Traders typically operate with a 3× stack. The most common breakpoint is a factor of approximately 4 to 6 between frames. For example, a swing trader might use Daily → 4-Hour → 1-Hour. A day trader might use 4-Hour → 1-Hour → 5/15-Minute. A scalper might use 1-Hour → 5-Minute → 1-Minute. The exact numbers matter far less than role clarity and consistency: the top frame is never for entry, the mid frame is rarely for entry, the lower frame is almost always for entry and immediate trade management.
Why MTFA Works: Alignment, Location, and Timing
MTFA improves your odds in three ways. First, alignment: when the higher- and mid-frame directions agree with the lower-frame setup, your trade swims with the current rather than against it. Second, location: you avoid buying into resistance or selling into support because the mid-frame exposes where you are inside the larger swing. Third, timing: the lower frame indicates when momentum shifts or a pattern is completed, thereby compressing risk while aiming for higher-frame targets. This triad—alignment, location, timing—is the reason MTFA remains a cornerstone of institutional playbooks across asset classes.
How Many Time Frames Should You Use?
Three is the sweet spot. Two often leaves blind spots, while four or more creates cognitive overload, contradictory signals, and execution paralysis. Each frame has a job:
- Higher Frame (HF): Define bias (bull, bear, balance), mark the key levels, and identify the phase (trend, pullback, range, breakout).
- Middle Frame (MF): Map structure (swings, channels, consolidation boxes), refine levels, and assess momentum & volatility regime.
- Lower Frame (LF): Wait for the trigger that expresses the higher idea with acceptable risk (candlestick pattern, micro break of structure, retest, or indicator confirmation).
Choosing Your Time-Frame Stack by Trading Style
Select a stack that matches your holding period, decision speed, and screen time. Longer frames move more slowly and require fewer decisions but larger stops and more patience. Shorter frames move faster, require maximum discipline, and demand strict risk controls. The table below summarizes proven stacks that traders can adopt without reinventing the wheel.
| Trading Style | Higher Frame (Bias) | Middle Frame (Structure) | Lower Frame (Trigger) | Trend Filter Example | Typical Holding Period |
|---|---|---|---|---|---|
| Position | Monthly / Weekly | Weekly / Daily | Daily / 4H | Price above/below 200MA Weekly | Weeks to Months |
| Swing | Daily | 4H | 1H / 30m | Daily higher highs/lows; RSI(14) trend | Days to 2 Weeks |
| Day Trading | 4H | 1H / 30m | 15m / 5m | 4H 50/200MA slope alignment | Intraday (hours) |
| Scalping | 1H | 5m | 1m / Tick-equivalent | 1H VWAP / moving average slope | Minutes to < 1 Hour |
Top-Down vs. Bottom-Up in Practice
Both reading directions are useful. Top-down is the default: scan the higher frame for bias, confirm structure on the mid frame, and hunt triggers on the lower frame. Bottom-up can be effective when you spot a powerful lower-frame signal; you then validate that it aligns with the mid and higher frames before committing. If a beautiful lower-frame long emerges directly into a higher-frame resistance, pass. If a lower-frame short forms right as the higher frame transitions from balance to downtrend, act decisively.
Core Concepts: Bias, Structure, Trigger, and Invalidations
Think like a checklist:
- Bias: HF directional assumption supported by market structure (higher highs/lows or lower highs/lows) and slope of long-term tools (e.g., 200MA, weekly RSI regime).
- Structure: MF mapping of swings, channels, ranges, supply/demand zones, and liquidity pools. Where is price relative to these?
- Trigger: LF event that allows precise execution (break-and-retest, engulfing pattern, inside-bar breakout, wedge resolution, micro trendline break, RSI/MACD cross with price confirmation).
- Invalidations: Levels where your idea is wrong. If hit, exit without negotiation.
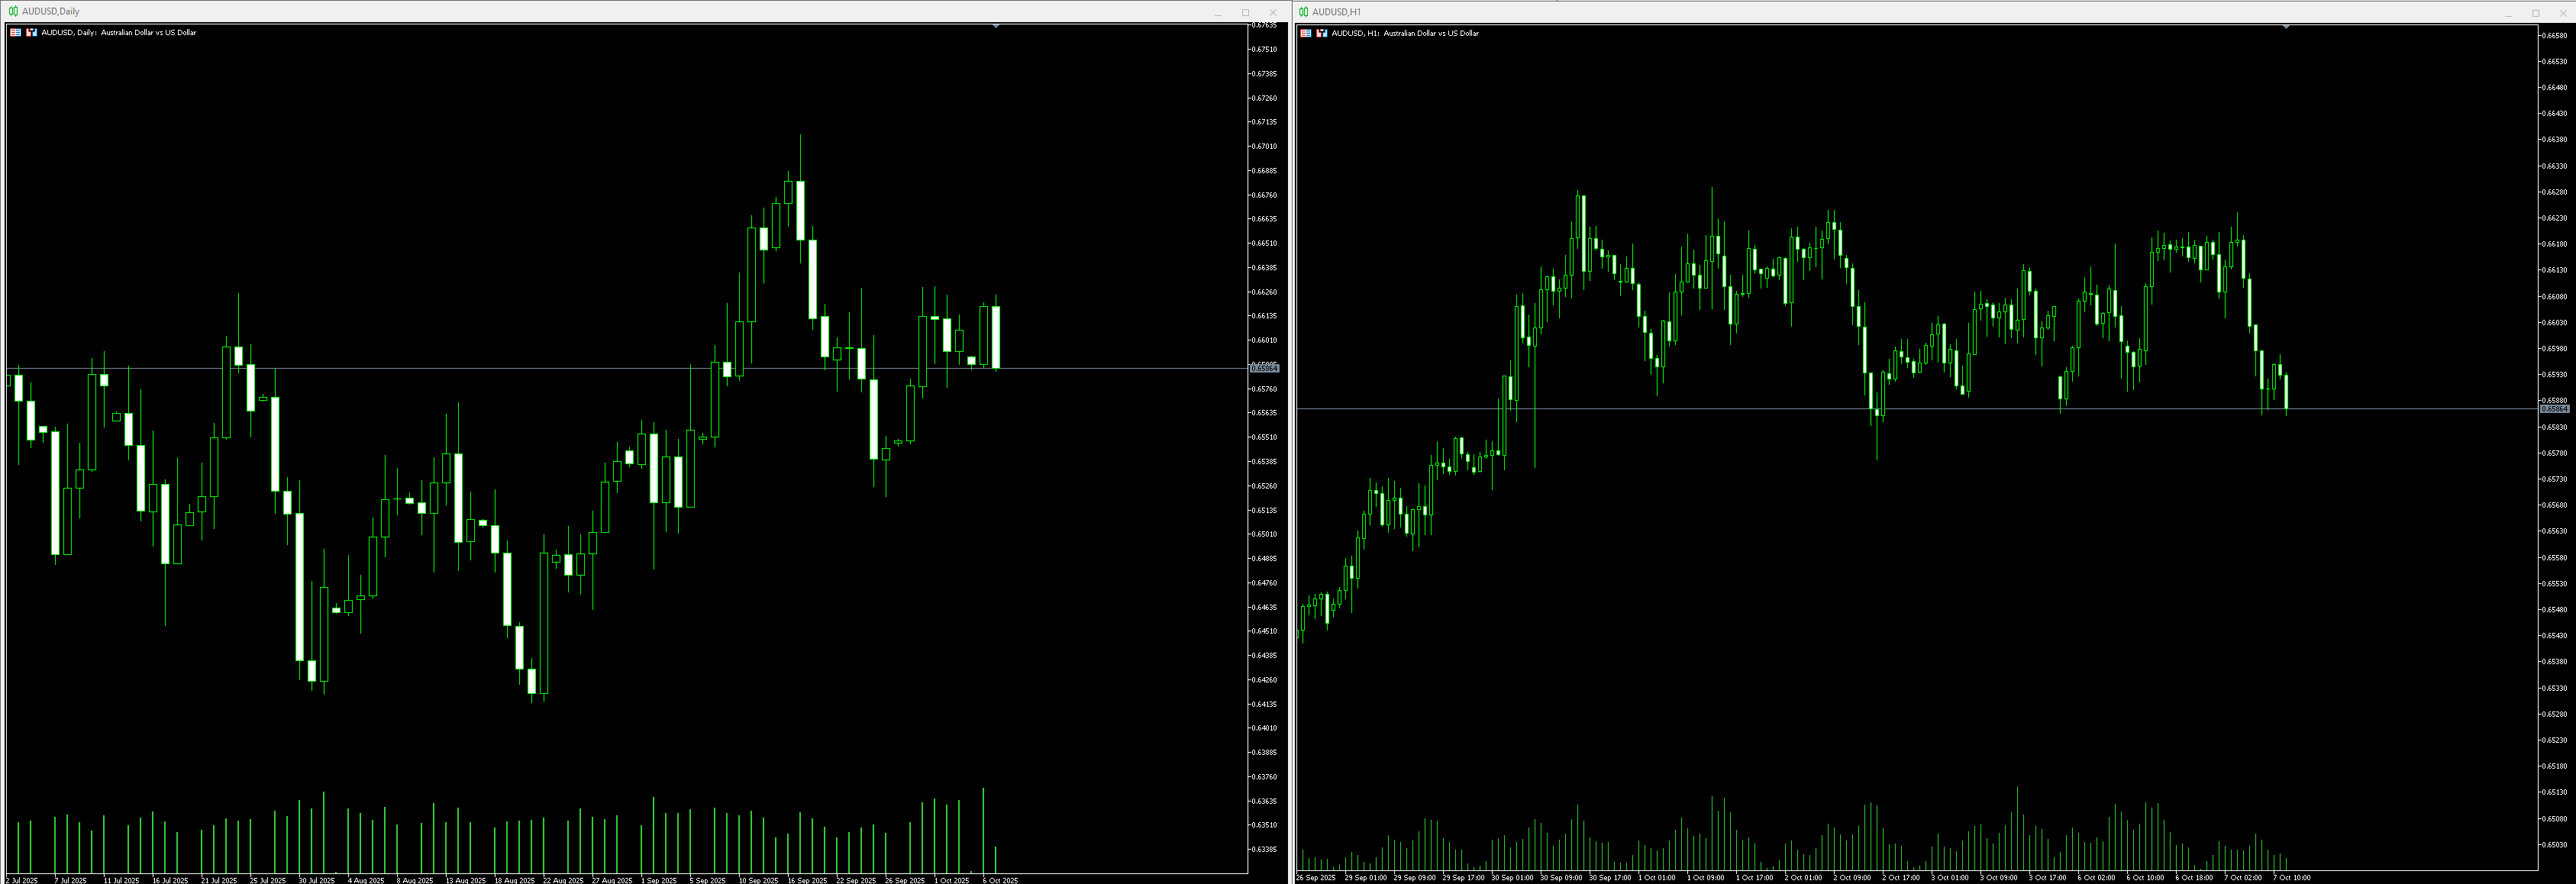
AUD/USD daily and hourly chart side-by-side, Source: MetaTrader 5
Step-by-Step Playbook: Swing Trader (Daily → 4H → 1H)
1) Higher Frame (Daily): Identify trend. Mark previous day/week highs & lows, swing points, dynamic support/resistance from moving averages. Note whether volatility is expanding or contracting and whether candles are closing near extremes (momentum) or with long wicks (indecision).
2) Middle Frame (4H): Convert the daily story into a tradable map. Draw the current channel or range. Mark mid-channel lines, range EQ (midpoint), and micro supply/demand zones caused by impulsive breaks. Determine whether price is pulling back to value (e.g., 4H 50MA in an uptrend) or breaking structure.
3) Lower Frame (1H/30m): Wait for a clean trigger. In trend-following longs, watch for a higher low forming at a 4H zone plus a bullish engulfing or break of a micro trendline, ideally with a volatility squeeze (narrow candles) expanding. Place the stop below the invalidation on the LF, but validate that this stop also makes sense on the MF. Set targets against MF levels (prior swing high, range boundary) and trail under 1H swing lows if momentum persists.
Step-by-Step Playbook: Day Trader (4H → 1H → 15m/5m)
1) Higher Frame (4H): Decide intraday bias by assessing where the session opens relative to 4H structure. Is price breaking out of a 4H box? Are we inside day conditions (likely mean-reversion) or post-breakout conditions (trend day potential)?
2) Middle Frame (1H/30m): Mark the session’s initial balance, identify pre-session liquidity sweeps, and note moving average slope alignment (e.g., 20/50/200). Locate the intraday “value” area—where price accepted in the prior sessions—and anticipate rotations or continuations.
3) Lower Frame (15m/5m): Execute. Classic entries include break-and-retest of the session opening range, failed break reversals, and pullbacks into the 1H moving average “stack” when 4H bias is strong. Stops go beyond the pattern invalidation. Targets are prior intraday extremes and measured moves. Avoid overtrading consolidations unless you specialize in range strategies.
Step-by-Step Playbook: Scalper (1H → 5m → 1m)
1) Higher Frame (1H): Keep it simple: define direction via 50/200MA slope and price relation to VWAP if available. Favor trades with the 1H gradient instead of counter-trend fades when spreads/commissions matter.
2) Middle Frame (5m): Identify micro swings, tight channels, mini liquidity pockets, and micro ranges. Recognize volatility regime (quiet vs. explosive).
3) Lower Frame (1m): Enter on micro break of structure, micro double bottom/top, or 1m wedge break in the 5m direction. Tight stops are essential. Scale out quickly at the first opposing 5m level. Do not let winners turn into losers; scalping is the ultimate “process discipline” test.
Integrating Indicators Without Overfitting
Indicators should confirm, not dictate. A robust MTFA stack can incorporate:
- Moving Averages: 20/50/200 as structural guides; slope and price relation indicate regime. Use longer MAs on HF/MF and shorter on LF.
- RSI: Treat 40–60 as midline. In uptrends, pullbacks often bottom near 40–50 on MF/LF; in downtrends, rallies often top near 50–60.
- MACD: Confirm momentum turns on LF after MF pullbacks; prioritize crossovers that occur at MF levels.
- Fibonacci: Anchor swings on MF; look for 38.2–61.8% confluence with prior structure before seeking LF triggers.
- ATR: Frame stop distance and realistic targets relative to current volatility; avoid tiny stops in high ATR regimes.
Always insist on multi-factor confluence: higher-frame bias + mid-frame level + lower-frame trigger, with at most one or two indicators as confirmation. If an indicator contradicts clean price structure, trust the structure.
Risk Management Tailored to MTFA
MTFA allows you to compress risk by entering on the LF while targeting MF/HF levels. But compression must not become recklessness. Follow these rules:
- Define invalidation on the LF and sanity-check it on the MF. If the LF stop sits right inside a major MF level, expect a sweep—place it beyond where the thesis is truly wrong.
- Position size via volatility: ATR-based stops adjust to regime. For example, if 1H ATR is 30 pips and your stop is 25 pips, size the position so the account risk per trade stays constant (e.g., 0.5%–1%).
- Pre-plan scaling: Take partials at the first MF obstacle, trail the remainder logically under/over LF swing points or a short moving average in trend.
- Daily loss limit: MTFA helps timing but cannot erase randomness. Cap daily drawdown to protect mental capital (e.g., 2–3R or 2% account risk).
Execution: A Pre-Trade Checklist
Before clicking buy or sell, confirm:
- HF Bias: Up, down, or balance? Are we trading with it?
- MF Structure: Where is price relative to the current swing, range edge, or channel?
- Level: Is there a clean MF level or zone? Any confluence (Fib, MA, prior high/low)?
- LF Trigger: Which pattern executes the idea (engulfing, break-retest, micro BOS)?
- Risk: Exact entry, stop, target. R-multiple acceptable (≥1.8–2.5R baseline)?
- Trade Management: Partial exit plan, trail logic, time stop if price stalls.
- News/Session: Any scheduled catalysts? Is liquidity typical for the session you are trading?
Common Mistakes and How to Fix Them
Mistake 1: Trading Against HF Bias. Fix: If you must counter-trend, require exceptional confluence (capitulation wicks, momentum shift on MF, strong LF trigger) and reduce size.
Mistake 2: Using MF for entry without LF confirmation. Fix: Respect the division of labor—MF is for mapping, LF for entries. Your average stop shrinks and your precision improves when you let LF do its job.
Mistake 3: Four or more frames leading to paralysis. Fix: Commit to a 3× stack for 30 trading days and log outcomes. Iterate afterward, not during the experiment.
Mistake 4: Stops inside noise. Fix: Place stops beyond invalidation and beyond obvious sweep zones. Use ATR to filter unrealistic tightness.
Mistake 5: Overreliance on indicators. Fix: Indicators should never overrule obvious structure. If they do, remove them for two weeks; bring them back later as minor confirmations.
Case Study A: Long Continuation with Confluence
Imagine EUR/USD in a daily uptrend, making higher highs and shallow pullbacks. On the 4H, price pulls back to a well-defined demand zone aligned with the 50MA and a 38.2% Fibonacci retracement of the last impulse. On the 1H, volatility compresses into an inside-bar cluster. The trigger is a 1H bullish engulfing that breaks the cluster high. The stop goes below the 1H swing low beneath the zone (and beyond an obvious liquidity sweep). The first target is the prior 4H swing high; the second target trails under 1H higher lows. This is classic MTFA: HF bias, MF location, LF timing.
Case Study B: Range Day Recognition and Adaptation
GBP/JPY shows no net progress on the 4H, with equal highs and equal lows creating a box. The 1H repeatedly rejects the range boundaries. On 15m, apparent breakouts fail quickly and revert to the mean. A day trader applying MTFA notes the HF balance and avoids trend-expectation trades. Instead, they fade the range edges on LF confirmation (e.g., bear trap above the range that closes back inside), taking small, quick profits to the range midpoint. MTFA here prevents trend chasing and optimizes expectations for range conditions.
Case Study C: Bear Trend Resumption After a Pullback
AUD/USD daily is in a downtrend. The 4H shows a counter-trend rally into a prior supply zone and the 200MA. On the 15-minute chart, momentum rolls over with a lower high, followed by a break of microstructure and a retest. The entry is on the retest rejection; the stop sits above the 15m lower high and beyond the supply wick. The trader targets the 4H swing low and leaves a runner in case the daily leg extends. Without MTFA, a trader might have bought the 15m strength into 4H/ daily headwinds. With MTFA, the short was the asymmetric play.
Building Your Personal MTFA Playbook
Document your preferred stack, tools, and triggers. Define exactly what a valid setup looks like and what disqualifies it. Include annotated screenshots of good and bad examples. Write out your scaling rules, how you will react to news, and your maximum number of trades per session. The more explicit your playbook, the easier it is to follow under pressure. MTFA thrives on clarity, and clarity is a product of writing things down.
Psychology: Patience, Selectivity, and Letting Trades Work
MTFA often asks you to wait. You may see an attractive LF pattern, but if the MF location is poor or the HF bias is unclear, the right decision is inaction. Patience feels unproductive, but wandering into low-quality trades is the true time sink. When you do take a trade with three-frame confluence, let it work. Do not micromanage because a single LF candle may appear intimidating. Remember which frame holds authority: a temporary LF wobble is irrelevant if the MF structure remains valid and the HF bias is intact.
Volatility Regimes and Session Nuance
Apply MTFA with respect for volatility and session behavior. Some pairs expand during London and contract during Asia; others react more violently to US data. If ATR contracts, expect fewer high-quality triggers and be selective. If ATR expands, widen stops and target further levels. MTFA does not guarantee more trades; it guarantees better trades when context, location, and timing synchronize.
Advanced Notes: Liquidity and “The Last Trap”
Markets frequently test obvious highs and lows before moving. MTFA helps you anticipate these liquidity sweeps. If HF bias is up and MF shows a clean demand zone below, do not be surprised if LF first pokes below the prior minor low (the “last trap”) to collect stops before reversing. Wise execution places stops beyond where the trap would be considered successful, not precisely at the obvious level. Accept that being “almost right” but “too tight” is still wrong.
From Theory to Routine: A Daily MTFA Workflow
Here is a simple routine you can adopt tomorrow:
- Scan your watchlist on the HF. Label each pair: trend up / trend down / balance.
- On MF, draw today’s battle map: key zones, range edges, channels, VWAP/MA stacks, and session markers.
- Set alerts at MF levels. Do not stare; let the platform call you when price arrives.
- When alerted, drop to LF and wait for your trigger. No trigger, no trade.
- Execute with predefined size and stop. Place targets and partials immediately; avoid on-the-fly improvisation.
- Journal the trade with screenshots of all three frames. Grade the setup quality (A/B/C) and your adherence to process.
Conclusion
Multiple Time Frame Analysis translates market complexity into a clean decision tree: define the higher-frame intention, locate price on the middle frame, and execute on the lower frame when the market hands you a trigger with measurable risk. This structure fosters patience, reduces noise, and channels your attention toward asymmetric opportunities. It does not remove uncertainty—nothing in trading does—but it organizes uncertainty into a framework where your edge can compound over hundreds of trades.
To make MTFA work for you, commit to a three-frame stack aligned to your lifestyle, codify your rules in a personal playbook, and enforce risk with mechanical consistency. Track your results over a fixed sample and iterate only after collecting meaningful evidence. In time, you will notice fewer impulsive entries, clearer management decisions, and a tighter feedback loop between planning and outcome. That is the quiet power of MTFA: not louder signals, but better context—and with it, better trades.
Frequently Asked Questions
What is the ideal separation between time frames?
A factor of roughly 4–6 works well (e.g., Daily → 4H → 1H or 4H → 1H → 15m). The key is role clarity: higher for bias, middle for structure, lower for trigger.
How many time frames should I use?
Three. Two often leaves blind spots, four or more invites analysis paralysis. Assign distinct jobs to each frame and stick to them.
Can MTFA be applied to any currency pair?
Yes. Adjust your expectations to the pair’s volatility and session tendencies. Pairs with higher ATR require wider stops and larger targets.
Which indicators work best with MTFA?
Use simple, robust tools: moving averages for structure, RSI for momentum regime, MACD for confirmation, and ATR for risk. Indicators should confirm price, not overrule it.
Do I always have to trade with the higher-frame trend?
Trading with the higher-frame trend offers the best expectancy. Counter-trend trades are possible but should be smaller and require stronger confluence and clearer invalidation.
How do I set stops using MTFA?
Define invalidation on the lower frame based on structure and place the stop beyond obvious sweep zones, then verify that the stop also makes sense on the middle frame. Use ATR as a sanity check.
What if the lower-frame trigger appears at a poor middle-frame location?
Pass. Location matters. Wait for price to return to a favorable zone or for the market to create a new structure that improves the trade’s context.
How does MTFA help during range conditions?
It identifies balance on the higher/middle frames so you avoid trend-expectation trades. Focus on fading range edges or wait for a legitimate break-and-hold with lower-frame confirmation.
Is MTFA suitable for beginners?
Yes, provided you keep it simple: adopt one 3× stack, define a small set of triggers, and journal every trade with screenshots of all three frames for learning and accountability.
Can MTFA reduce the number of trades I take?
Often yes—and that is a feature. MTFA filters out low-quality impulses, concentrating your risk on higher-quality, higher-confluence opportunities.
How do I integrate news events with MTFA?
Mark high-impact events on your calendar. If a trigger appears just before a release, either skip it or reduce size. After the event, reassess HF/MF structure and hunt LF triggers aligned with the new context.
What is the fastest way to improve my MTFA?
Create a personal playbook with precise definitions, gather 50–100 annotated examples, and run a 30-day “no changes” trial on your chosen stack. Review results, then iterate deliberately.
Note: Any opinions expressed in this article are not to be considered investment advice and are solely those of the authors. Singapore Forex Club is not responsible for any financial decisions based on this article's contents. Readers may use this data for information and educational purposes only.