
Bollinger Bands have become one of the most recognizable and widely applied tools in modern technical analysis, particularly in the realm of forex trading. Created by John Bollinger in the 1980s, they were originally designed to address a fundamental challenge: how to measure volatility in a way that adapts to changing market conditions. Unlike fixed indicators that impose rigid thresholds, Bollinger Bands expand and contract dynamically in response to volatility, providing traders with a flexible framework for interpreting market behavior. In forex markets, where currencies can shift direction in response to a single news headline or economic release, this adaptability is especially valuable.
To appreciate the importance of Bollinger Bands, it is worth reflecting on the nature of forex itself. With trillions of dollars traded daily, the foreign exchange market is not only large—it is constantly in motion. Prices fluctuate in response to announcements of interest rate decisions, the release of inflation figures, or the emergence of geopolitical tensions. These events create waves of volatility that can catch traders off guard. A tool that automatically adjusts to these fluctuations does more than just provide information—it offers a valuable perspective. Bollinger Bands enable traders to quickly assess whether current price levels are extreme in relation to recent history or whether the market is relatively stable.
At their core, Bollinger Bands are not about predicting the future with certainty. Instead, they provide context. They help traders identify whether the price is relatively high or low compared to its recent average. This contextual framework is powerful because markets are driven not just by fundamentals but by perceptions of value and risk. When traders see that the price has touched or exceeded the upper band, they may interpret the market as overextended. Conversely, when the price nears or dips below the lower band, it may suggest oversold conditions. While these observations do not guarantee reversals, they highlight areas where the balance of buying and selling pressure may shift.
The versatility of Bollinger Bands explains their enduring popularity. For beginners, they offer a clear visual tool for identifying overbought and oversold conditions. For experienced traders, they can form the basis of complex strategies involving breakouts, squeezes, or volatility-based position sizing. They are equally relevant for scalpers analyzing minute-by-minute price action and long-term investors studying weekly or monthly charts. This universality makes them an indispensable component of many trading systems.
What Are Bollinger Bands?
Bollinger Bands are a volatility-based indicator that overlays three distinct lines on a price chart. The middle line is a simple moving average, typically set at 20 periods. This average provides a smoothed view of the price over a defined time window. The upper and lower bands are then plotted at a specified number of standard deviations—usually two—above and below this moving average. Together, these three lines create a channel that reflects the statistical distribution of price.
The genius of this design lies in its simplicity. The middle band serves as a reference point, while the upper and lower bands adjust automatically in response to volatility. When markets are calm, the bands contract, hugging the price closely. When volatility increases, the bands expand, reflecting the widening range of possible outcomes. This adaptive quality ensures that Bollinger Bands remain relevant in all types of markets, from quiet consolidations to explosive breakouts.
In forex trading, Bollinger Bands serve several functions simultaneously. They help identify relative highs and lows, signal potential reversals, and provide a framework for breakout strategies. A price that consistently touches the upper band indicates sustained buying pressure, while a price near the lower band suggests selling pressure. However, it is important to emphasize that touching a band is not in itself a buy or sell signal. It simply indicates that the price has reached an extreme relative to its recent average. Traders must use additional context—such as candlestick patterns, momentum indicators, or support and resistance zones—to decide whether to act on these extremes.
Another strength of Bollinger Bands is their universality. They are not limited to a single currency pair, asset class, or timeframe. Whether analyzing EUR/USD on a five-minute chart or GBP/JPY on a weekly chart, Bollinger Bands provide consistent insights. Their application across markets reinforces their value as a foundational tool of technical analysis.
- Middle Band: A 20-period simple moving average (SMA) of price.
- Upper Band: Calculated as the SMA plus two standard deviations.
- Lower Band: Calculated as the SMA minus two standard deviations.
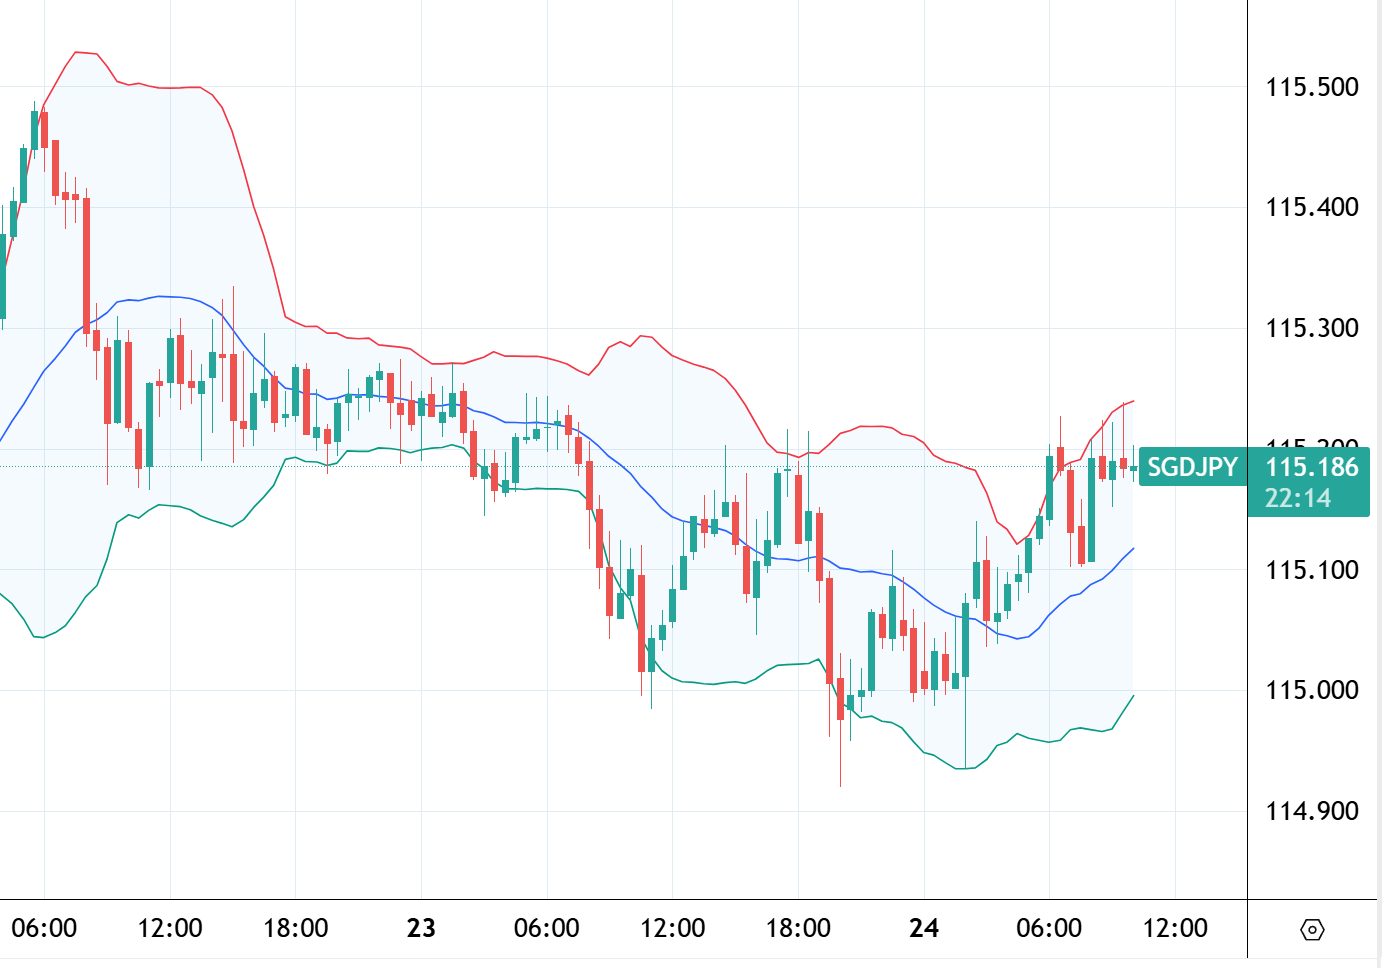
SGD/JPY 30-min chart with Bollinger Bands, Source: TradingView
The distance between the upper and lower bands widens when volatility increases and narrows when volatility decreases. This dynamic nature makes Bollinger Bands especially useful in forex, where volatility shifts constantly due to economic data releases, central bank actions, and geopolitical events.
How Are Bollinger Bands Calculated?
Understanding the calculation of Bollinger Bands is critical because it reveals why they are so effective in adapting to changing market conditions. At the heart of the indicator is the simple moving average (SMA). By default, Bollinger Bands use a 20-period SMA, which smooths price action over 20 bars of the chosen timeframe. This moving average becomes the middle band, serving as the anchor for the entire structure.
Next comes the concept of standard deviation, a statistical measure of how much individual data points deviate from the average. In trading terms, standard deviation measures how volatile price has been over the same 20 periods. If price tends to stay close to the moving average, standard deviation is low, and the bands remain narrow. If the price fluctuates dramatically, the standard deviation increases, and the bands expand.
The upper band is calculated as:
Upper Band = 20-period SMA + (2 × standard deviation)
The lower band is calculated as:
Lower Band = 20-period SMA − (2 × standard deviation)
The number “2” here represents the multiplier for standard deviations. While two is the most common setting, traders can adjust it depending on their objectives. A multiplier of 1.5 produces tighter bands that are more sensitive to price changes, while a multiplier of 2.5 creates wider bands that filter out more noise. Similarly, the length of the SMA can be shortened for faster-moving signals or lengthened for smoother, more stable bands.
These calculations explain why Bollinger Bands are unique. They do not impose arbitrary boundaries on price; they reflect the actual volatility of the market. When volatility contracts, bands narrow, signaling that the market is consolidating. When volatility expands, bands widen, signaling increased uncertainty and potential trading opportunities. This dynamic quality makes Bollinger Bands a living, breathing indicator—one that evolves with the market rather than imposing fixed thresholds.
How Traders Use Bollinger Bands in Forex
- Identify Overbought and Oversold Conditions: When the price touches the upper band, it may be considered overbought; when it touches the lower band, it may be considered oversold.
- Measure Volatility: Bands that contract indicate low volatility, while expansion suggests increased volatility.
- Trend Confirmation: Price riding along the upper band indicates strong bullish momentum, while price along the lower band indicates bearish momentum.
- Signal Generation: Band breakouts and squeezes often precede significant moves.
Common Bollinger Band Strategies
While Bollinger Bands can be applied in various ways, most strategies center on three fundamental concepts: mean reversion, breakout anticipation, and trend following. Before diving into specific strategies, it is essential to understand the underlying logic behind each one.
The first idea, known as mean reversion, assumes that the price tends to revert to its average after reaching an extreme. When the price touches the upper or lower band, traders interpret this as a potential overextension. This does not mean price will reverse immediately, but it highlights areas where a pullback toward the middle band is likely.
The second idea, breakout anticipation, focuses on the observation that periods of low volatility are often followed by high volatility. When the bands contract tightly around price—a phenomenon known as the “squeeze”—it signals that the market is coiling before a potential breakout. Traders closely watch for directional confirmation, as a breakout can lead to strong moves.
The third idea, trend following, recognizes that price can ride the upper or lower band during strong trends. In such cases, touching a band does not indicate overbought or oversold conditions, but rather confirms the strength of the trend. Traders who understand this distinction can use Bollinger Bands not to fight the trend but to stay aligned with it.
These core ideas form the foundation of the most common Bollinger Band strategies, which we will explore in detail later.
Bollinger Band Squeeze
The squeeze occurs when bands contract to their narrowest range, signaling a period of low volatility. Traders interpret this as a precursor to a breakout, though other signals must confirm the direction of the breakout.
Bollinger Bounce
The price often reverts toward the middle band after touching either the upper or lower band. Traders use this tendency for mean-reversion strategies, entering trades in anticipation of a bounce back toward the moving average.
Trend Riding with Bollinger Bands
When the price continuously rides the upper band, it suggests strong bullish momentum. Conversely, riding the lower band indicates bearish momentum. Traders may use this to stay in trends longer.
Advantages and Limitations
| Advantages | Limitations |
|---|---|
| Adapts to changing volatility conditions | Not predictive—shows current volatility only |
| Identifies overbought/oversold zones | False signals are possible in strong trends |
| Versatile across strategies and timeframes | Requires confirmation with other indicators |
| Simple to visualize and interpret | Subjective interpretation of band touches |
Advanced Uses of Bollinger Bands
Advanced traders take Bollinger Bands beyond basic strategies by integrating them with other tools and concepts. One advanced use is the Bollinger Band width, which measures the distance between the upper and lower bands. Band width can act as a standalone indicator of volatility, helping traders quantify when markets are unusually quiet or unusually active. For instance, a historically low band width may indicate that a significant breakout is imminent.
Another advanced technique is combining Bollinger Bands with momentum oscillators such as the Relative Strength Index (RSI) or the Moving Average Convergence Divergence (MACD). For example, if price touches the lower band while RSI shows oversold conditions, the convergence of signals increases the probability of a rebound. Conversely, if the price touches the upper band while the MACD indicates bullish momentum, it may suggest that the trend still has strength.
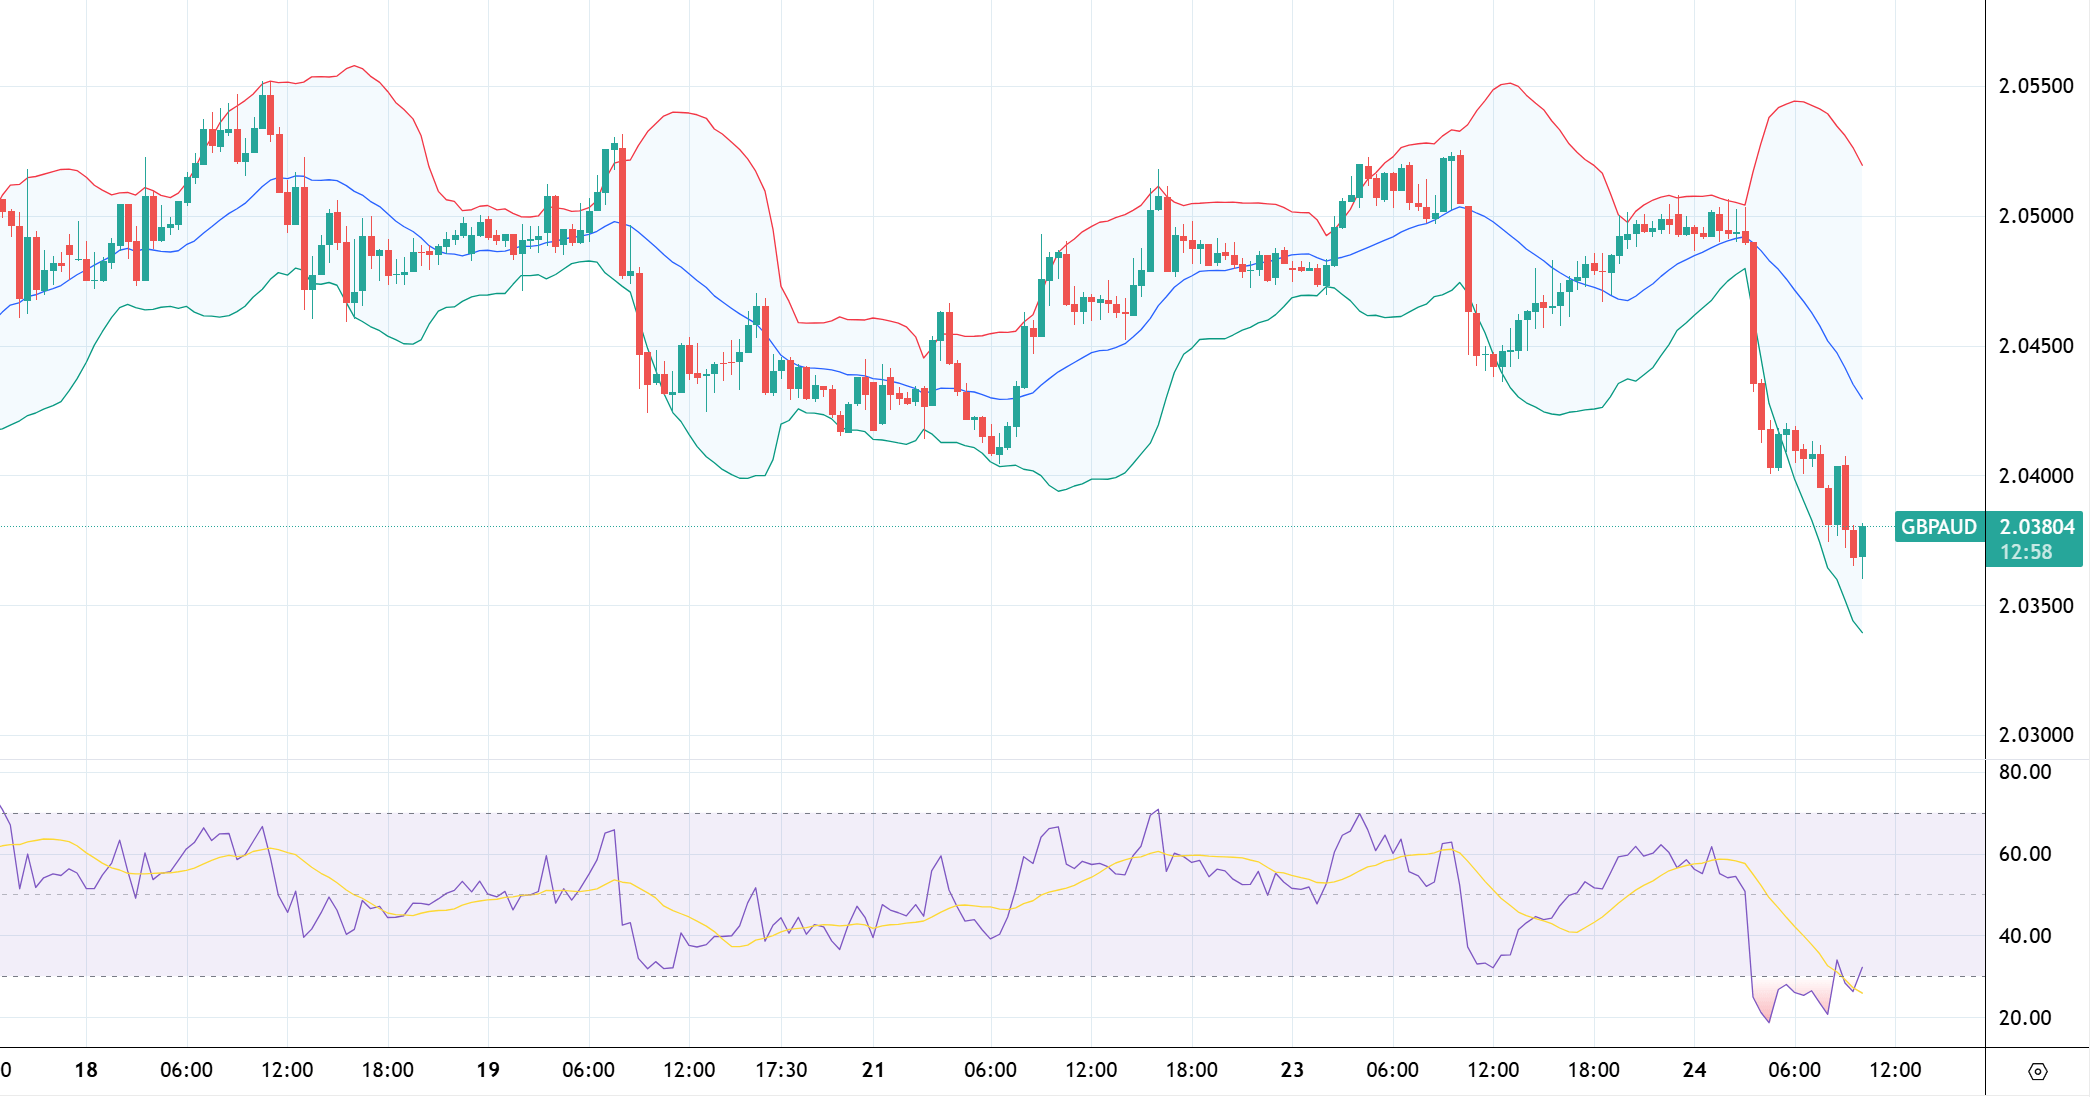
GBP/AUD 30-min Chart with Bollinger Bands and RSI, Source: TradingView
Some traders also apply Bollinger Bands in multi-timeframe analysis. They might use bands on a daily chart to identify the broader volatility context while trading on an hourly chart for precision entries. This alignment ensures that short-term trades are made in harmony with longer-term conditions.
Algorithmic and quantitative traders often incorporate Bollinger Bands into systematic strategies. For instance, a program might execute trades automatically whenever the bands contract below a certain threshold, anticipating breakouts. Others might calculate Bollinger Band width across dozens of currency pairs simultaneously, scanning for the most promising opportunities.
Finally, advanced users explore alternative settings and variations of Bollinger Bands. Some replace the SMA with an exponential moving average (EMA) for faster responsiveness. Others adjust the standard deviation multiplier or combine Bollinger Bands with Keltner Channels to create hybrid indicators. These variations highlight the adaptability of Bollinger Bands—they are not a rigid formula but a flexible framework that can evolve with different strategies and trading environments.
Conclusion
Bollinger Bands stand out as one of the most versatile and enduring tools in technical analysis, particularly in forex trading. Their genius lies in their ability to adapt to volatility, offering traders a framework that is as relevant today as it was when John Bollinger introduced it decades ago. By combining a moving average with bands that expand and contract based on standard deviation, they transform raw price data into actionable insights about market behavior.
For beginners, Bollinger Bands provide a straightforward way to recognize relative highs and lows. They highlight potential overbought and oversold conditions and encourage traders to think in terms of averages and extremes. This helps new traders avoid the common mistake of chasing price without context. For professionals, Bollinger Bands offer deeper possibilities: they can be used for mean reversion strategies, breakout anticipation, trend following, and multi-timeframe confluence. Their adaptability makes them suitable for both discretionary traders and algorithmic systems.
Yet, as with any tool, Bollinger Bands are not infallible. They do not predict direction; they describe volatility. A price touching the upper band is not automatically a sell signal, nor is a touch at the lower band automatically a buy. Without confirmation from other tools—such as momentum indicators, candlestick patterns, or fundamental context—traders risk misinterpreting the signals. The strength of Bollinger Bands lies in integration, not isolation.
Perhaps the greatest lesson Bollinger Bands teach is about discipline. By providing a structured framework, they help traders avoid emotional decision-making. When volatility contracts, bands signal patience. When volatility expands, they signal readiness. This rhythm mirrors the market’s natural cycle of quiet and activity, teaching traders to respect timing as much as direction.
In the end, Bollinger Bands are more than just lines on a chart. They represent a philosophy of trading: adapt to changing conditions, respect volatility, and seek context rather than certainty. For those who master them, Bollinger Bands become not only a technical tool but also a psychological anchor. In the unpredictable world of forex trading, that combination of clarity and discipline can make the difference between confusion and confidence, between inconsistency and long-term success.
Frequently Asked Questions
What is the best setting for Bollinger Bands in forex?
The default setting is a 20-period SMA with bands set at two standard deviations, though traders may adjust these based on their trading style.
Can Bollinger Bands predict breakouts?
Bollinger Bands do not predict direction, but a squeeze often signals that a breakout is imminent. Traders need additional confirmation to determine the likely direction.
Are Bollinger Bands suitable for all timeframes?
Yes. Bollinger Bands can be applied to intraday, daily, or weekly charts, making them versatile across trading styles.
Do professional traders use Bollinger Bands?
Yes. Many professionals incorporate Bollinger Bands into broader strategies, often combining them with momentum or volume indicators for confirmation.
Note: Any opinions expressed in this article are not to be considered investment advice and are solely those of the authors. Singapore Forex Club is not responsible for any financial decisions based on this article's contents. Readers may use this data for information and educational purposes only.


