Volatility is the oxygen of trading: too little and strategies suffocate; too much and positions burn out. The Average True Range (ATR) sits at the center of any serious approach to volatility because it answers a foundational question: how much does this market typically move? Created by J. Welles Wilder Jr., ATR was designed to capture the true amplitude of price movement, including overnight gaps and sharp intraperiod swings. Unlike directional indicators, ATR does not attempt to forecast up or down. Instead, it quantifies the magnitude of movement—information you can leverage to size positions, place stops, trail profits, filter trades, and time breakouts.
This guide dives far beyond textbook definitions. You will learn how ATR is constructed and why Wilder’s formulation still matters; how to interpret spikes, squeezes, and regime shifts; how to normalize risk across pairs with different personalities; how to transform ATR into rules for stops, trailing exits, and adaptive targets; and how to combine ATR with structure, momentum, and trend to build robust, testable setups. We will also discuss common mistakes, practical checklists, and realistic case studies you can model in your own journal and backtests. By the end, you will not only “know” ATR—you will be able to use it with discipline and nuance.
What Is ATR? A Volatility Lens Without Direction
Average True Range is a moving average of the True Range (TR), which measures the most expansive price movement that realistically impacted traders between two consecutive periods. That “realistic” part is crucial: simple range (high minus low) ignores gaps and jump moves that occur between closes—ATR does not. This makes ATR a more faithful gauge of the actual turbulence that can shake a position.
Because ATR is direction-agnostic, it complements trend and momentum tools rather than competing with them. Think of ATR as the market’s volume knob. Trend determines the song; ATR determines how loud it is. In quiet regimes, you can reduce position size or demand tighter confirmation. In roaring regimes, you widen stops, trim size, and let winners breathe.
How ATR Is Calculated (Step by Step)
First, compute the True Range for each bar:
- TR1: Current High − Current Low
- TR2: |Current High − Previous Close|
- TR3: |Current Low − Previous Close|
The True Range is the maximum of TR1, TR2, and TR3 for that bar. Then, compute ATR as a moving average of TR values. Wilder used a smoothing method equivalent to an exponential moving average:
ATRt = (ATRt−1 × (n−1) + TRt) ÷ n
where n is the lookback (commonly 14). The first ATR is typically a simple average of the first n TRs.
Worked Example: From TR to ATR
Imagine a 5-bar sequence (using simplified pips). Suppose the TR values per bar are: 22, 18, 35, 12, 26. The initial ATR over 5 bars would be (22 + 18 + 35 + 12 + 26) / 5 = 22.6. The next bar’s ATR (using Wilder’s smoothing) blends the prior ATR with the new TR, preventing whipsaw. This smoothing property gives ATR its stability while still responding to news events or breakouts.
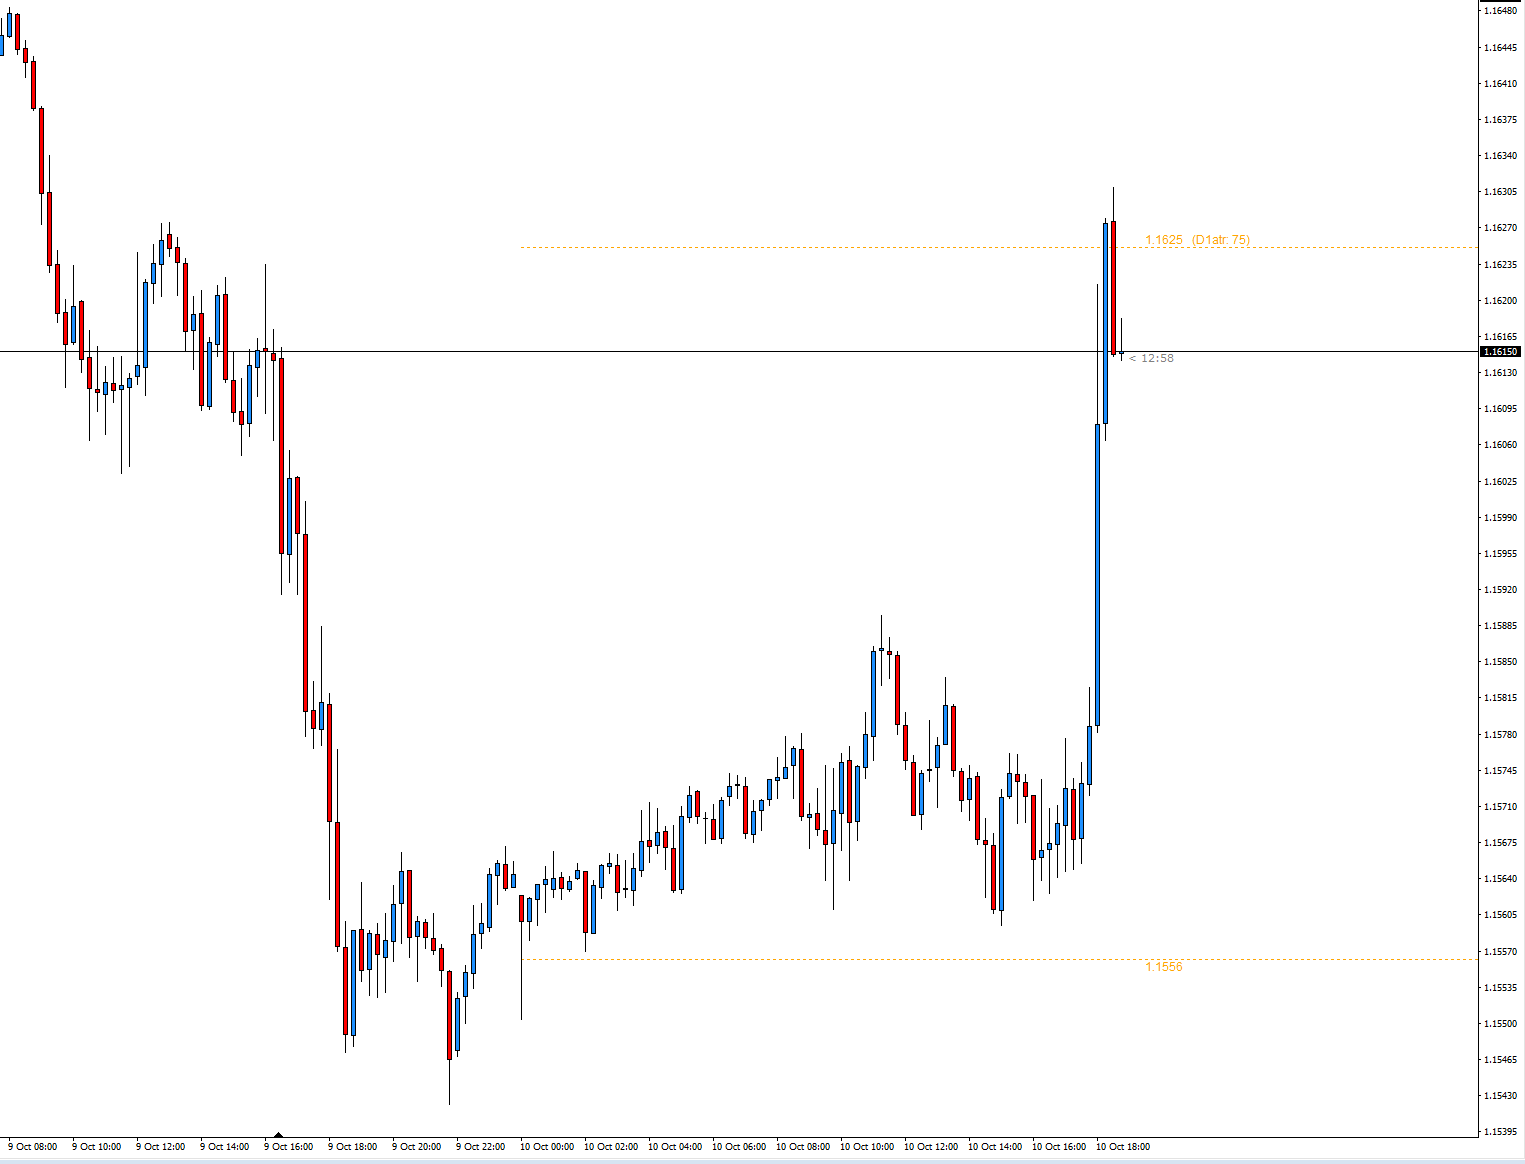
EUR/USD 15-minute chart with ATR projected, Source: MetaTrader 4
ATR Settings and Timeframes: Choosing the Right Lens
The classic setting is 14 periods, but your timeframe dictates behavior. A 14 on the daily chart captures two to three weeks of trading—good for swing traders. A 14 on the M15 chart captures roughly a trading session—useful for day traders. Shorter lookbacks (e.g., 7) react faster but can be noisy; longer lookbacks (e.g., 20 or 21) smooth more but respond slower to regime changes. The key: align ATR to your decision cycle. If you plan and review trades daily, a daily ATR drives your stop templates and sizing. If you scalp, intraday ATR belongs in your playbook.
Reading ATR in Context: Spikes, Squeezes, and Regime Shifts
ATR breathes. It contracts during consolidation and expands during impulsive phases. Three patterns matter most:
- ATR Squeeze: Prolonged low ATR often precedes a range break. Expect false breaks when the structure is messy; demand confirmation from momentum or volume proxies.
- ATR Spike: A sudden surge after news or a break from balance. Spikes can mark the start of a trend or the end of a capitulation. Watch follow-through and closing location.
- Regime Shift: When ATR transitions from a low-volatility channel to a persistently higher one, average bar risk rises. Adjust stop widths and position sizes accordingly.
Comparison Table: ATR vs Other Volatility Tools
| Tool | What It Measures | Strengths | Limitations | Best Use |
|---|---|---|---|---|
| ATR | Absolute price movement, including gaps | Simple, robust, platform-agnostic | No direction, lagging by design | Stops, sizing, trailing, filters |
| Standard Deviation | Dispersion around a mean | Theoretically grounded, pairs with bands | Assumes distribution traits not always present | Volatility channels, z-score filters |
| Bollinger Band Width | Band expansion/contraction | Visual squeeze/expansion cues | Depends on SMA choice; includes direction bias | Breakout anticipation, mean reversion |
| Average Daily Range (ADR) | Mean daily high-low range | Intuitive daily goalpost | Ignores gaps between days | Daily target setting, session planning |
| Historical Volatility (HV) | Statistical annualized volatility | Comparable across assets | Abstract for intraday use | Macro/top-down risk regime analysis |
Using ATR to Set Initial Stop-Losses
Stop placement should reflect the typical “breathing room” of price. ATR delivers that yardstick. A common template is:
- Trend-following: 1.5× to 2.5× ATR beyond structural invalidation (e.g., below a swing low in longs).
- Mean reversion: 1.0× to 1.8× ATR away from entry, depending on congestion and catalysts.
- Breakout: 1.0× to 2.0× ATR from entry, recognizing higher immediate turbulence.
The idea is not to worship a multiplier but to pair it with structure. For example: stop = min(technical invalidation, structural level) − buffer where buffer ≈ 1.0× ATR. The buffer acknowledges that markets probe edges before choosing direction.
ATR for Trailing Stops: Letting Winners Breathe
Once in profit, you can trail a stop at a fixed multiple of ATR from the highest close (for longs) or lowest close (for shorts). Popular choices range from 1.5× to 3.0× ATR. Tighter trails lock gains sooner but risk whipsaw. Wider trails allow trend development but give back more open equity. A practical approach is to tighten the multiple when ATR expands aggressively—because increased turbulence raises the probability of snapbacks.
Position Sizing with ATR: Normalizing Risk Across Pairs
Two pairs can have identical pip stops but very different dollar risks because pip value and typical movement differ. ATR-based sizing solves this by making volatility the denominator:
- Define risk per trade (e.g., 0.5% of equity).
- Compute stop distance in pips using an ATR multiple.
- Convert pips to account currency risk based on pair and lot value.
- Size the position so that (pips at risk × value per pip × lots) equals your dollar risk.
This keeps your portfolio’s volatility exposure consistent across EURUSD, GBPJPY, XAUUSD, or indices CFDs.
Adaptive Targets and Time Exits with ATR
ATR also calibrates expectations. If a pair’s daily ATR is 90 pips and you are long after a clean structural break, a 1.0× to 1.5× ATR objective aligns with typical travel distance absent exceptional catalysts. You can also create time exits: if price fails to progress by at least 0.5× daily ATR within two sessions, cut or reduce. Stagnation in a supposed expansion is often information.
Combining ATR with Trend, Momentum, and Structure
ATR is most powerful when used with other lenses:
- Trend filters: Use a moving average or market structure (higher highs/lows) to determine direction; use ATR to size and place stops.
- Momentum confirmation: Pair ATR expansion with momentum thrusts to confirm break quality.
- Structure: Anchor stops beyond swing points or value areas, then add an ATR buffer.
ATR in Trending vs. Ranging Markets
In ranges, ATR typically compresses. Breakouts from value are suspicious until ATR expands alongside directional closes. In trends, ATR can remain elevated for weeks, demanding wider stops and modest size. Your playbook should explicitly state what you do when ATR compresses (e.g., stand aside or switch to fade edges with tight ATR stops) versus when it expands (e.g., trade breakouts or pullbacks with wider ATR risk).
ATR by Trading Style: Scalper, Day Trader, Swing, Position
- Scalper: Intraday ATR (e.g., M5/M15) sets micro-stop templates and targets; consider half-ATR intraday goals.
- Day trader: Use session ATR to decide whether to trade expansion plays; avoid choppy sub-ATR mornings without catalysts.
- Swing trader: Daily ATR drives 1.5×–3.0× trails and multi-session targets; respect event risk when ATR swells.
- Position trader: Weekly ATR smooths noise; combine with macro structure and add wider, lower-frequency adjustments.
Case Study #1: The Quiet Squeeze That Became a Trend
After weeks of declining ATR on a major pair, intraday ranges shrank, and the frequency of failed breakouts increased. Your plan: no directional trades until daily ATR turns up and a daily close leaves the value area. Two days later, ATR hooks upward, the pair closes outside balance with a momentum candle, and pullbacks hold above broken resistance. Entry on the first pullback, stop 2.0× daily ATR below the swing low, partials at 1.0× ATR, trail at 2.0× ATR. Outcome: the wide ATR-based trail prevents premature exit as the trend unfolds, even as intraday retracements deepen.
Case Study #2: News Spike—Volatility Without Trend
A central bank headline jolts price, and ATR spikes. Instead of chasing, your rules require a second day of elevated ATR and directional close before trend trades. The next session prints a mean-reversion hammer with no follow-through; ATR remains high but directionless. You avoid a costly whipsaw, proving that ATR spikes alone are not signals—context and closing strength matter.
Case Study #3: Breakout Filter with ATR
Your breakout model triggers only if the session range exceeds 0.8× the 20-session ATR and closes beyond a clearly defined boundary. This single filter eliminates many weak pushes. When it does trigger, you commit but size prudently because ATR confirms that the day’s energy is sufficient to sustain a move.
Common Mistakes When Using ATR (and Fixes)
- Using ATR as a directional tool: Fix by pairing ATR with trend/momentum; ATR alone does not say “buy” or “sell.”
- Fixed pip stops across pairs: Replace with ATR-based stops to normalize risk and reduce random stop-outs.
- Ignoring regime changes: When ATR shifts higher for weeks, widen stops and cut size; when it compresses, do the opposite or stand aside.
- Overfitting multipliers: A 1.73× ATR stop is rarely superior to 1.5× or 2.0× across regimes. Favor robustness over perfect backtest fit.
- No time stops: If price moves less than a fraction of ATR over your expected window, exit or reduce—the trade thesis is likely wrong.
Backtesting and Optimization with ATR
Test ATR in ways that mirror how you will trade it:
- Define regime rules: What constitutes an ATR squeeze or expansion in your system?
- Specify stop/target logic: Use discrete ATR multiples and structural anchors.
- Use walk-forward testing: Optimize on one sample, validate on the next. Repeat across multiple pairs and regimes.
- Measure slippage: High-ATR days often mean worse fills; simulate conservative assumptions.
- Track drawdowns by regime: Many systems fail in choppy, mid-ATR conditions. Label trades by ATR percentile and analyze.
Building Your ATR Playbook: Practical Templates
- Initial stop (trend): Structure invalidation plus 1.5× ATR buffer.
- Initial stop (breakout): 1.5×–2.0× ATR from entry, reduced size on news days.
- Trailing (swing): 2.0× ATR from highest close; tighten to 1.5× after third push.
- Targeting: Base on 1.0×–1.5× daily ATR unless a catalyst supports extension.
- Time stop: If unrealized move < 0.5× daily ATR after two sessions, cut or halve.
Risk, Correlation, and Portfolio Construction with ATR
ATR balances pair personality, but portfolio risk also depends on correlation. A basket of JPY crosses may share the same driver. Allocate risk at the portfolio level using ATR-adjusted sizing per position and a maximum total ATR exposure by theme. This way, a single macro surprise does not overwhelm the account.
Execution Nuances: Spreads, Sessions, and Slippage
ATR speaks to volatility, but execution is where the edge is realized. In Asia sessions, ATR can be lower on many pairs—attractive for range fades with tight ATR stops. Around London and New York overlaps, ATR rises—better for momentum and breakout tactics. Widen your assumed slippage in high ATR conditions, and avoid placing stops exactly at round multiples of ATR that coincide with obvious structural levels.
Integrating ATR into a Rules-Based System
A robust system might read:
- Trade only when daily ATR percentile > 40 and increasing.
- Enter on a pullback to structure in the direction of trend confirmed by momentum.
- Initial stop = swing invalidation − 1.5× ATR buffer.
- First partial at 1.0× daily ATR; trail remainder at 2.0× ATR from highest close.
- Time stop: exit if price advances < 0.5× daily ATR after two sessions.
This is testable, repeatable, and adaptable. You can vary the ATR thresholds by pair or regime once you have sufficient data in your journal.
Conclusion
Average True Range is simple, but its disciplined application is transformative. It converts vague ideas of “this feels volatile” into concrete, position-level decisions: how much to risk, where to place and trail stops, when to stand aside, and when to expect extension. ATR is not a signal generator—it is a context engine. When you combine it with structure and momentum, it becomes the backbone of a professional risk framework. Start with modest, robust multipliers. Journal by regime. Test what you trade.
The edge is not just in knowing ATR, but in executing the same logic, the same way, through quiet squeezes and roaring spikes alike.
Frequently Asked Questions
What does ATR actually tell me?
ATR measures the typical size of price movement over a lookback window. It does not predict direction. Use it to scale risk, set stops, trail profits, and gauge when the market is quiet or loud.
What is the best ATR setting for forex?
There is no universal best. 14 periods is a robust default. Day traders may prefer 10–14 on intraday charts; swing traders often use 14–21 on daily charts; position traders can look to weekly ATR for a slower lens.
How do I choose my ATR stop multiplier?
Start with simple tiers (1.0×–2.5×) and test across pairs and regimes. Pair the multiplier with structural invalidation (e.g., beyond a swing point). Avoid hyper-optimized, pair-specific values that may not generalize.
Can ATR be used as a standalone trading system?
No. ATR is not directional. It excels as a risk and context module within systems that define trend, momentum, or mean-reversion edges.
How do I use ATR for position sizing?
Define fixed percent risk per trade (e.g., 0.5%–1%). Determine stop distance via ATR multiple. Convert that stop to account-currency risk and size the position so that a stop-out equals your chosen risk.
Should I change ATR settings for different pairs?
The lookback can remain constant, but your multipliers or trade selection may change. High-beta pairs or metals often need wider buffers or smaller size. Validate this with journal data.
How does ATR help with take-profit decisions?
ATR sets realistic distance targets. For example, in a daily expansion with ATR ≈ 90 pips, a 1.0× ATR target is a rational first partial. In catalysts with strong follow-through, you can trail and let it extend.
Why does ATR sometimes stay high without clear trends?
Events can create choppy, two-way volatility. ATR rises because bars are large, but direction alternates. Require additional filters (directional closes, momentum confirmation, structure breaks) before committing.
How does ATR compare to Average Daily Range (ADR)?
ADR is the mean of daily ranges and ignores the relationship to prior closes. ATR incorporates gaps and intersession jumps via the TR definition, making it a more complete measure for risk work.
Can I combine ATR with Bollinger Bands or Donchian Channels?
Yes. For instance, trade breakouts only when the breakout bar’s range exceeds a fraction of daily ATR and closes outside a band or channel. This filters weak moves and improves quality.
How should I adapt to ATR regime shifts?
When ATR rises and persists, widen stops and cut size; when ATR compresses, tighten stops and size up only if the setup edge historically performs in quiet conditions. Otherwise, stand aside until expansion.
What is a good way to trail winners with ATR?
A common rule is 2.0× ATR from the highest close for longs (lowest close for shorts). Tighten to 1.5× after multiple pushes or when ATR explodes to lock in a larger share of open equity.
Does ATR work on all markets?
Yes. ATR is widely used in forex, indices, commodities, and crypto. Pip value and tick size differ, but the logic—normalize risk to volatility—translates across instruments.
How do I prevent overfitting ATR in backtests?
Use coarse multipliers (e.g., 1.0×, 1.5×, 2.0×), test across many pairs and years, and validate with walk-forward splits. If a setting only works on one pair or year, it is likely curve-fitted.
Should I place stops exactly at ATR multiples?
Avoid “on-the-nose” placement that coincides with round numbers or obvious structure. Add a small discretionary buffer to reduce clustering around commonly watched levels.
Note: Any opinions expressed in this article are not to be considered investment advice and are solely those of the authors. Singapore Forex Club is not responsible for any financial decisions based on this article's contents. Readers may use this data for information and educational purposes only.