
Support and resistance levels form the backbone of price action analysis. Whether you're trading forex, equities, cryptocurrencies, or commodities, these concepts are among the most referenced, studied, and misunderstood in technical analysis. Yet despite their apparent simplicity, drawing and trading support and resistance correctly remains one of the most elusive skills for both new and seasoned traders. Many see levels react after the fact but fail to anticipate them; others clutter their charts with arbitrary lines, mistaking noise for structure.
This article aims to demystify support and resistance by going beyond superficial definitions and instead focusing on the underlying psychology, practical methods, and strategic frameworks necessary to use them effectively. We will explore not only what support and resistance are, but also how they emerge from the collective behavior of market participants, how to identify and validate them across various timeframes, and how to utilize them to build powerful trade setups with clear risk-to-reward profiles.
Importantly, we will also address the nuances: why some levels are effective while others fail, how to avoid common pitfalls such as overfitting and hindsight bias, and how to integrate support and resistance with other tools, including volume, candlestick patterns, and indicators. Through this comprehensive guide, you'll gain not just techniques but a new way of thinking about market structure.
What Are Support and Resistance Levels?
Support and resistance levels represent areas on a chart where the price has historically tended to react. A support level is a zone where the price has difficulty falling below, as demand overcomes supply. Conversely, resistance is where the price has difficulty rising above, due to increased selling pressure. These zones act like invisible “floors” and “ceilings” for price movement — though they are not impenetrable, they are statistically significant enough to shape expectations.
Support and resistance can be static or dynamic, horizontal or sloped, derived from raw price action or indicator-based zones. Regardless of their form, their function remains the same: to reflect where a significant number of market participants previously took action, whether to enter, exit, or adjust positions.
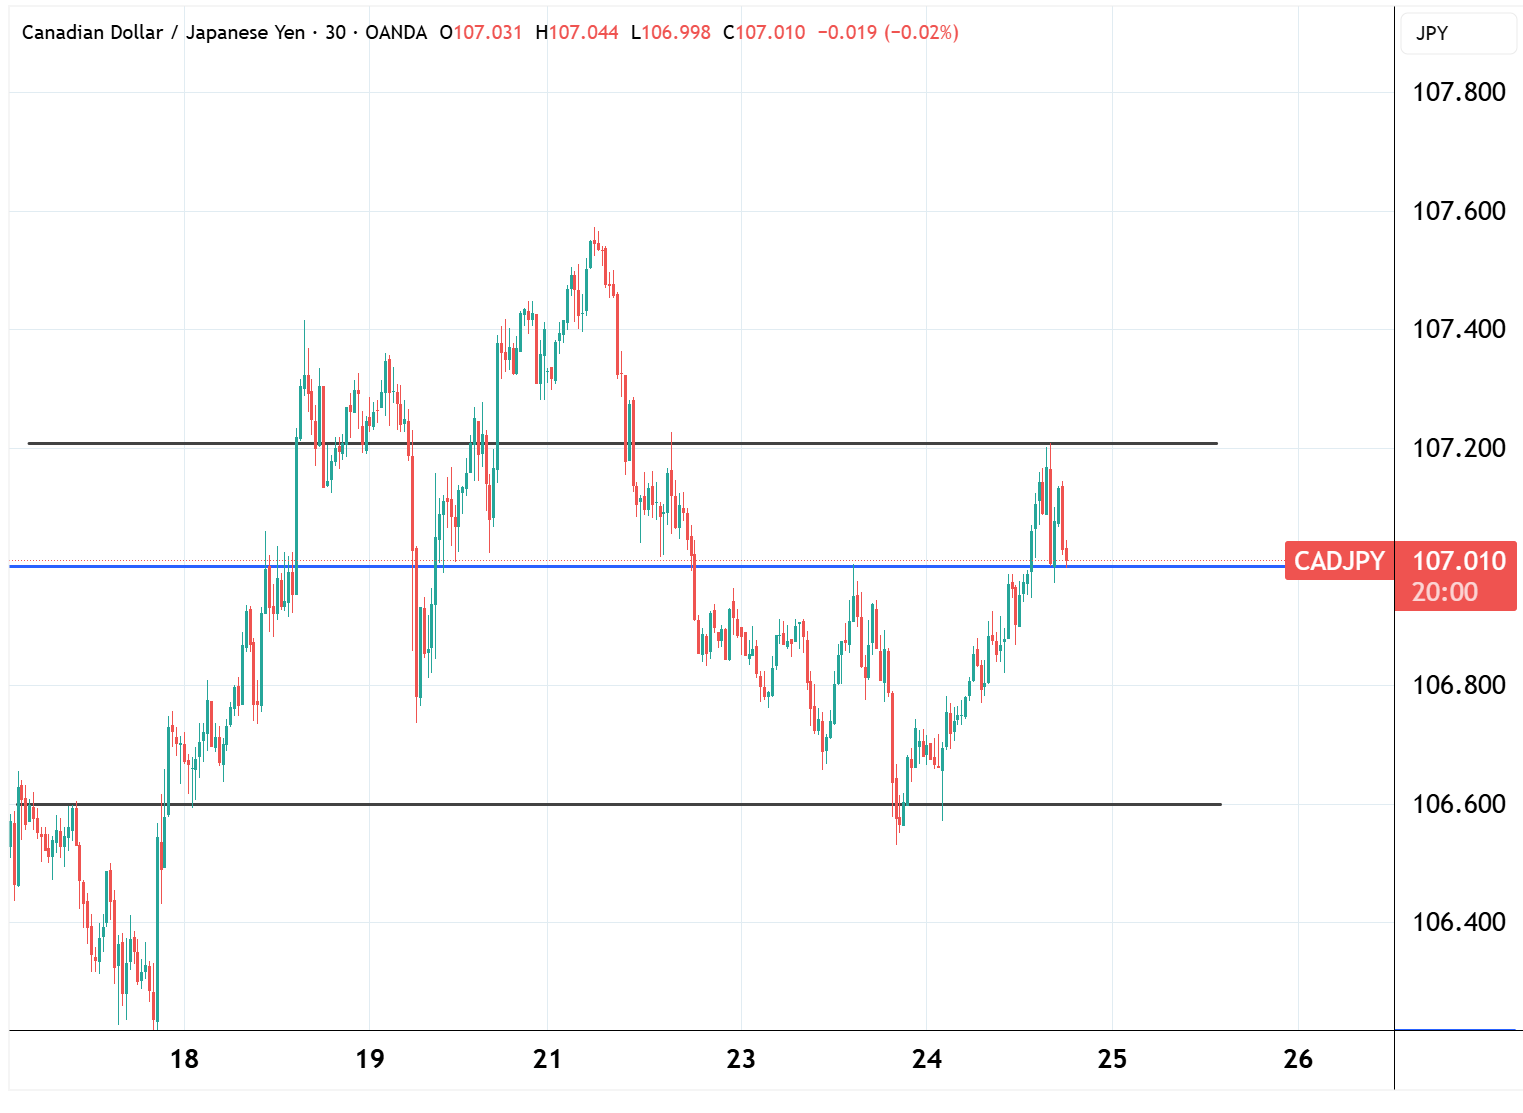
CAD / JPY, 30-min chart with market support and resistance, Source: TradingView
Rather than treating these levels as absolute boundaries, experienced traders view them as zones of probability. Price may “test” these levels, penetrate them temporarily, or consolidate around them before moving decisively. Understanding this fluidity is key to trading them effectively.
Why Are They Important in Trading?
The reason support and resistance levels are foundational is that they emerge from the aggregated memory of the market. Price doesn’t just move randomly; it reflects the tug-of-war between buyers and sellers, informed by history, news, fundamentals, and expectations. When a price level has caused significant reversal or consolidation in the past, it becomes a focal point for future trades — even if subconsciously.
Support and resistance provide structure to otherwise chaotic markets. They allow traders to anchor their decisions: where to place entries, where to set stop-losses, and where to aim for take-profits. They also enable probabilistic thinking. A trader who identifies a strong support zone may be more confident to buy there, knowing it has historically attracted buyers.
Moreover, support and resistance play a vital role in strategy validation, risk management, and trade planning. Whether you use price action, trend following, breakout strategies, or mean reversion, these levels serve as reference points that inform the context.
Psychological Foundations Behind Support and Resistance
To fully grasp support and resistance, one must understand the human behaviors that create them. Markets are not purely mechanical; they are reflections of emotion, fear, greed, memory, and crowd psychology. Every line you draw on a chart is ultimately a manifestation of the past decisions of thousands of traders reacting to similar stimuli.
Support often forms when traders believe an asset is undervalued at a certain price, causing them to buy in large numbers. Resistance appears when an asset is considered overvalued, triggering widespread selling. But deeper than that, these zones are shaped by regret, hope, and anticipation. A trader who missed a buy opportunity may wait for the price to return to a support level to enter. Someone who lost money after shorting a breakout may place stops just above resistance next time, creating a feedback loop.
This psychological feedback loop is what makes support and resistance self-fulfilling. The more times a level is tested, the more traders notice it — and the more likely it is to cause a reaction. But there's a caveat: levels that are “too obvious” can become liquidity traps, manipulated by larger players who fade retail positions. Understanding this dynamic helps avoid simplistic interpretations.
Types of Support and Resistance
Horizontal Levels
Horizontal support and resistance levels are the most common and intuitive. These are flat, static price levels where the market has reversed direction or stalled in the past. They often stand out visually, making them easy to identify even for novice traders. Key horizontal levels usually form around previous swing highs and lows, consolidations, and price clusters. For example, if a currency pair reverses several times around 1.2000, that level may be viewed as a strong horizontal resistance.
These levels work well because they reflect collective market memory. Traders who remember a price struggling at a particular level in the past are likely to react again when the price approaches it. Additionally, horizontal levels are widely used in institutional models, making them self-reinforcing due to crowd behavior.
Trendlines
Trendlines act as dynamic support and resistance, sloping up or down to reflect the direction of price over time. An ascending trendline, drawn by connecting higher lows in an uptrend, can act as support. Conversely, a descending trendline connecting lower highs in a downtrend may act as resistance. These lines provide a framework for understanding the path of least resistance in trending markets.
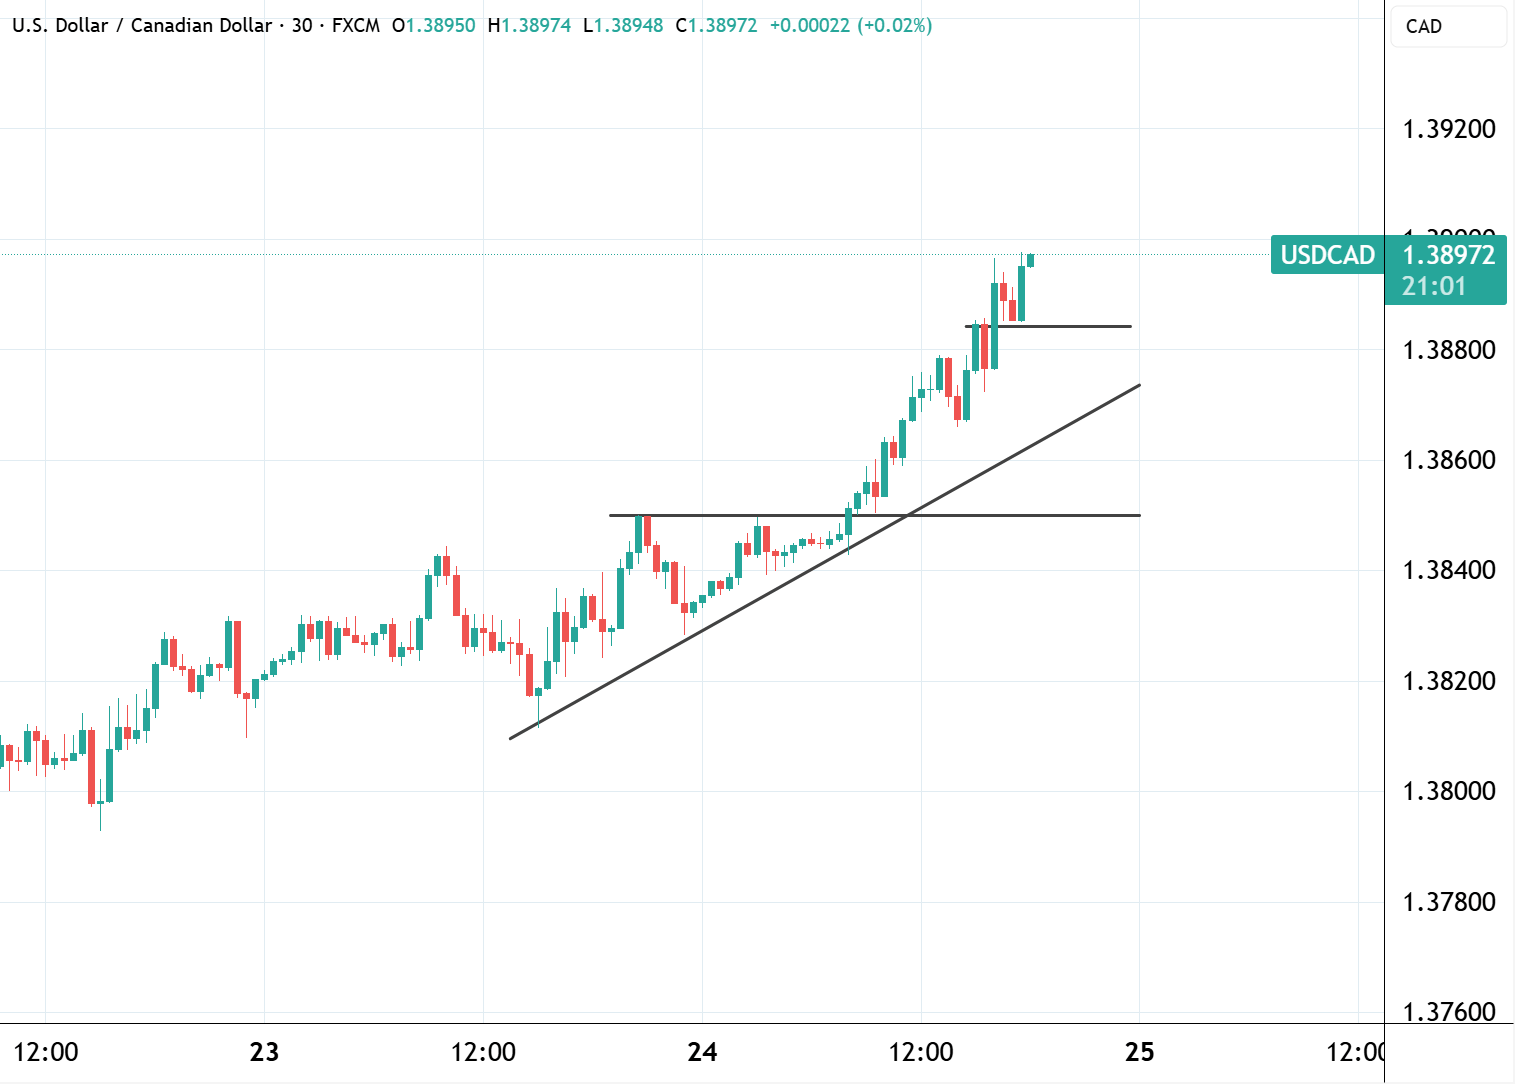
USD CAD, 30-min chart with support, resistance, turned support, and a trendline; Source: TradingView
Trendlines are inherently subjective and can vary slightly depending on the trader’s methodology. The more touches a trendline has without being broken, the more significant it becomes. However, like horizontal levels, trendlines are better viewed as zones rather than precise lines, as prices may temporarily overshoot them.
Dynamic Levels (Moving Averages)
Some support and resistance zones are not fixed in price but shift dynamically. Moving averages, particularly the 20-, 50-, 100-, and 200-period averages, are commonly used to identify such zones. In trending markets, moving averages often act as support during pullbacks in uptrends or resistance during bounces in downtrends.
The strength of a moving average as a support/resistance level depends on its alignment with other technical elements such as horizontal levels, trendlines, or volume spikes. For instance, if price retraces to a rising 50 MA that also aligns with a previous support zone, the confluence increases its significance.
Round Numbers
Human psychology favors round numbers. Price levels like 1.0000, 1.0500, or 1.5000 in forex, or $100 and $500 in stocks, often act as invisible walls in the market. These levels attract trader attention, institutional order flow, and options activity. As such, they frequently serve as support and resistance levels, even in the absence of prior price action at that level.
Round numbers are especially powerful when they coincide with key technical levels. Traders often place stop-losses just above or below such prices, making them zones of high liquidity and potential volatility. Smart money is aware of this and often uses these areas to trigger stops and then reverse direction.
Volume-Based Zones
Volume profile and market profile tools can identify areas where high amounts of trading activity have occurred. These high-volume nodes (HVNs) and low-volume nodes (LVNs) often act as support and resistance. When price returns to a region with previous heavy activity, the memory of market participants leads to renewed buying or selling interest.
Volume-based support and resistance is especially useful in ranging markets and for longer-term swing traders. Unlike simple price-based levels, these zones reflect actual traded volume, providing more context about market conviction at different price points. They can be used alongside horizontal levels for added confidence.
In practice, the best support and resistance levels are often combinations of the above: a horizontal level near a round number, aligned with a moving average, and confirmed by volume. This convergence of factors is called confluence — and it significantly enhances the reliability of any single level.
How to Identify Support and Resistance Levels
Step-by-Step Identification Process
Identifying support and resistance levels begins with analyzing historical price action. The process typically involves scrolling back on a chart and marking areas where price has stalled, reversed, or consolidated multiple times. The more frequently price reacts at a level, the more significant it becomes. Start by identifying swing highs and lows, then look for areas of congestion or candles with long wicks — these often indicate price rejection.
Use multiple timeframes. Begin with the daily or weekly chart to identify major levels, then transition to the 4-hour or 1-hour chart for greater precision. Higher timeframe levels carry more weight, while lower timeframe zones can be used for tactical entries. Always zoom out before zooming in — this prevents you from mistaking short-term noise for structure.
Manual vs Automated Tools
Many platforms offer automated support and resistance indicators. While these can be helpful for beginners, they often rely on fixed formulas and lack the nuance of discretionary analysis. Manual drawing, though more time-consuming, allows for a contextual understanding of market dynamics and adapts better to unusual patterns.
That said, combining both approaches can be powerful. Use automated tools to highlight potential zones, then manually validate them. Look for alignment with psychological levels, moving averages, and volume-based areas to confirm strength.
Confirmation Techniques
Not all levels are created equal. To confirm whether a support or resistance level is likely to hold, traders use several techniques:
- Repetition: Has price reacted at this level multiple times?
- Volume: Was there a spike in trading volume at this level?
- Candlestick Patterns: Are there reversal signals like pin bars, engulfing candles, or dojis near the level?
- Context: Does the level align with the overall trend?
- Confluence: Is the level reinforced by a trendline, moving average, or Fibonacci level?
Confirmation helps avoid false assumptions and improves the probability of successful trades based on the levels.
How to Draw Support and Resistance Accurately
Wicks vs Closes
One of the most debated topics is whether to draw support and resistance levels using candle wicks (highs/lows) or closes (body ends). Both approaches have merit. Wicks show the extreme price rejection and are useful for identifying precise reaction points. Closes, however, represent consensus and may be more reliable in spotting levels where most volume was transacted.
In practice, it's best to treat support and resistance as zones rather than thin lines. Use a range that includes both wicks and closes, especially in volatile markets. This helps avoid missing entries or exits by a few pips or cents due to overly rigid level placement.
Using Zones Instead of Lines
Price does not respect lines — it respects zones. Drawing a support/resistance area as a band instead of a single price helps account for market noise and liquidity sweeps. These zones are typically 5 to 20 pips wide in forex or a few dollars wide in stocks, depending on volatility.
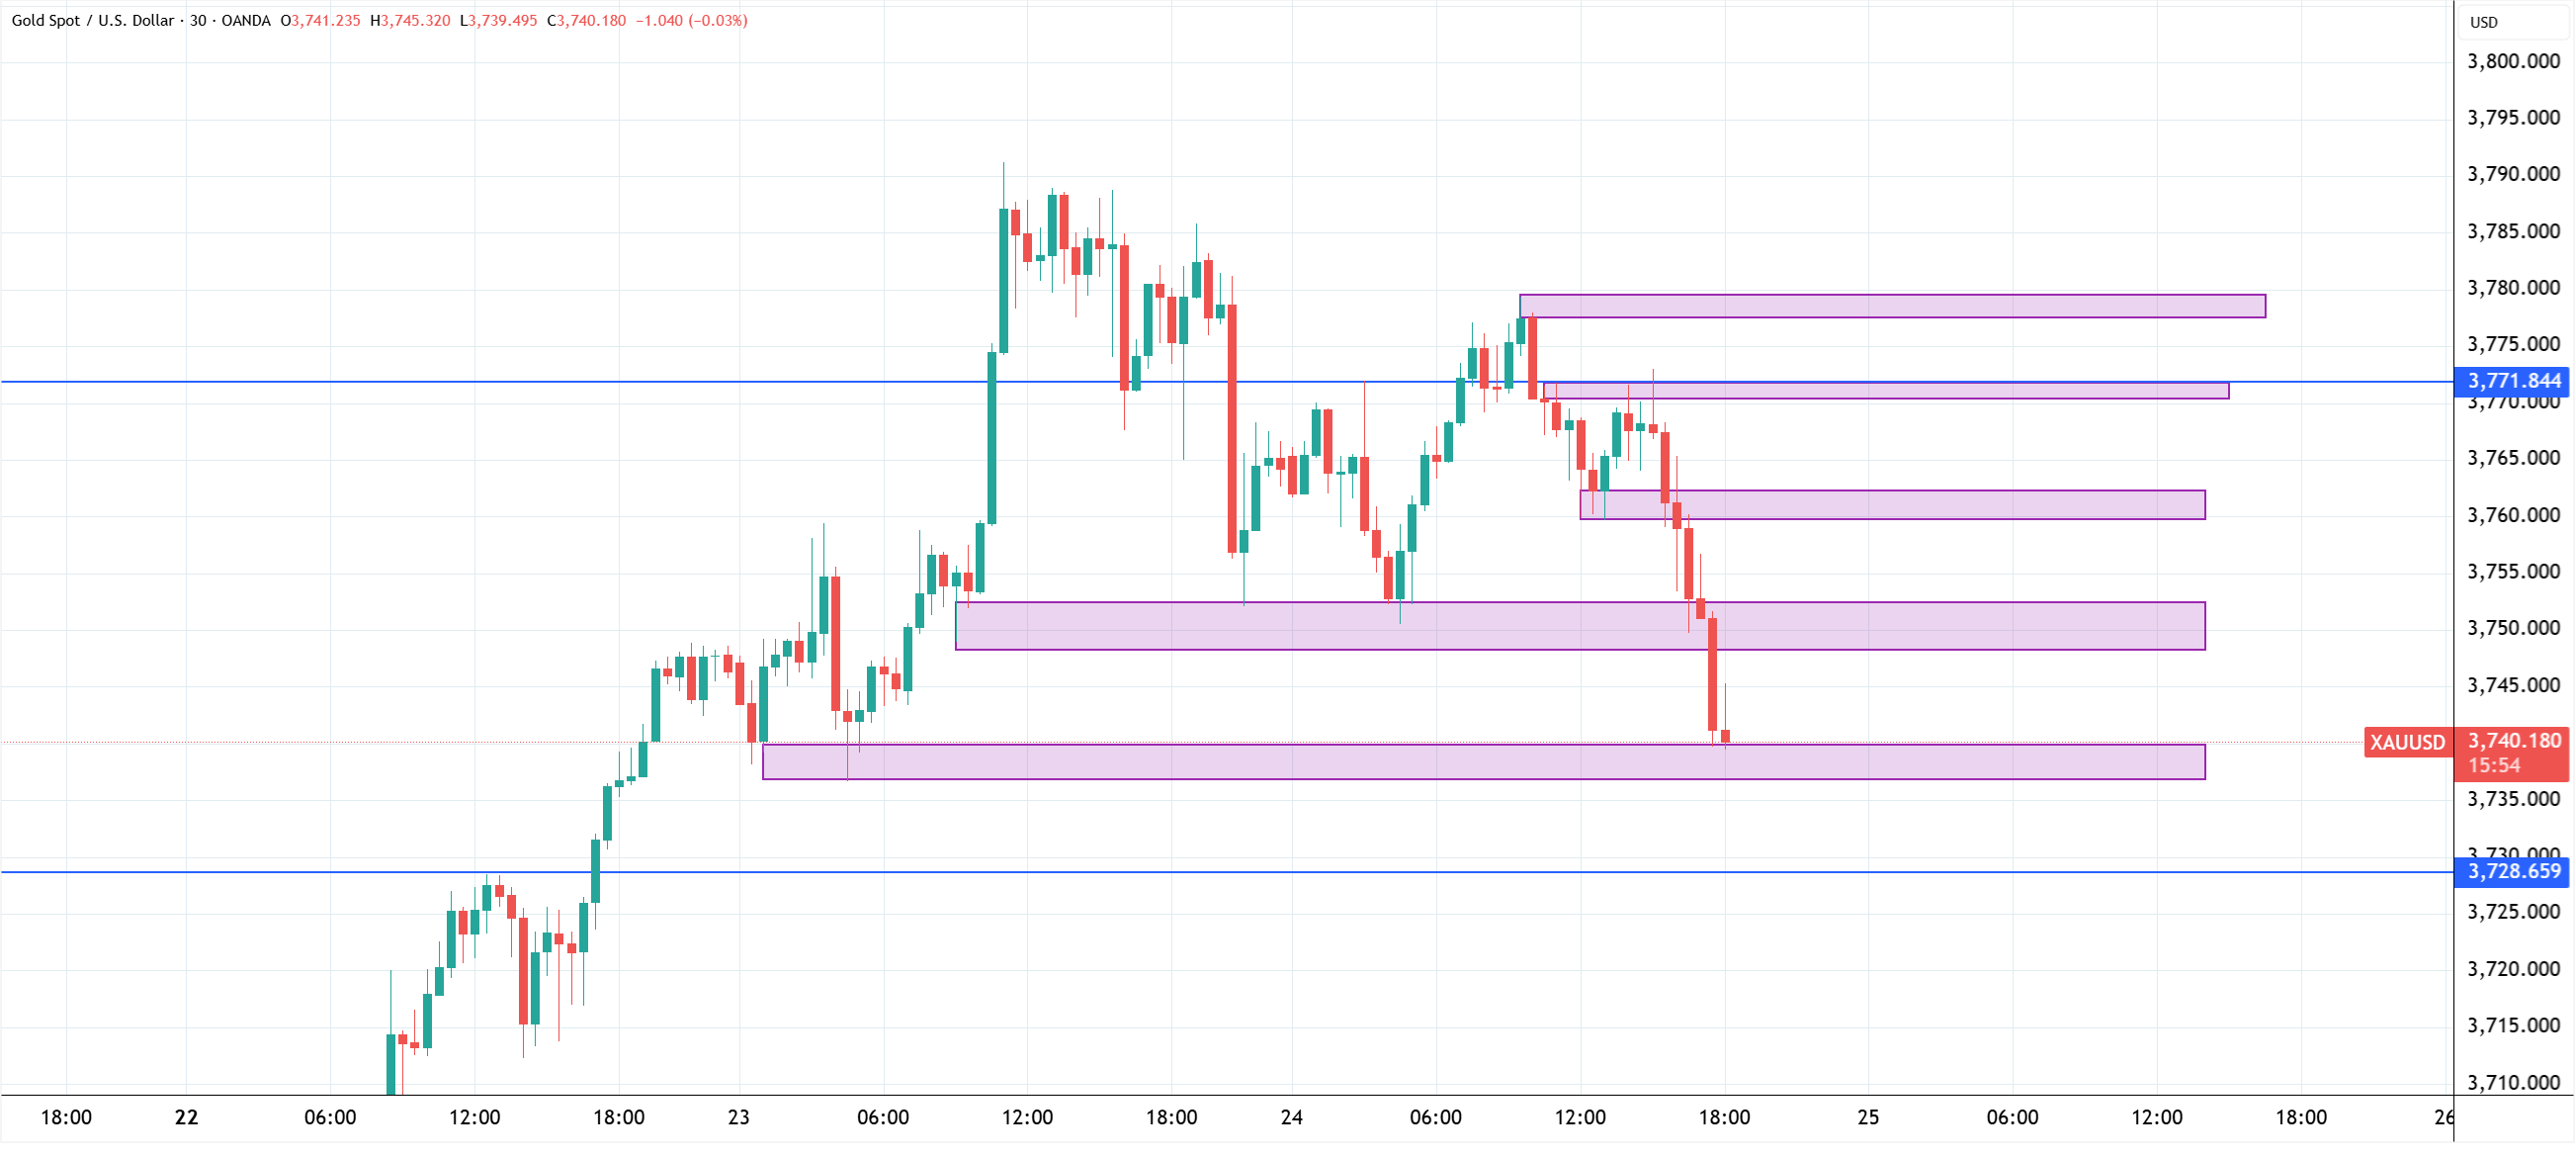
XAU/USD 30-min chart with marked zones of support and resistance, Source: TradingView
Zones also help you avoid getting shaken out of good trades. For example, price might pierce a support line but close back inside the zone, indicating a false breakout. Without that flexibility, traders may panic and exit prematurely or enter too late.
Choosing the Right Timeframes
The timeframe you use affects the strength and reliability of your levels. Support and resistance on higher timeframes (daily, weekly) are more powerful and less likely to be broken quickly. These should form the backbone of your analysis.
Lower timeframes (15m, 1h, 4h) offer precision for entries but are more prone to noise. Ideally, combine both: use the daily chart to find major zones, and the 1H to refine your trading plan. This multi-timeframe approach ensures you are trading within context.
Common Mistakes When Using Support and Resistance
Despite the simplicity of the concept, many traders misuse support and resistance. Here are the most common mistakes:
- Overfitting: Drawing too many levels clutters the chart and confuses decision-making. Focus on the most reactive, obvious levels.
- Ignoring Higher Timeframes: Only analyzing the 5-minute chart leads to unreliable levels. Always zoom out first.
- Using Perfect Lines: Expecting price to bounce off an exact number leads to frustration. Use zones instead.
- Not Adjusting Levels: Markets change — levels should be updated as new highs/lows form or as old levels lose significance.
- Confirmation Bias: Forcing trades at levels simply because they’re drawn, without waiting for signals or confluence.
Avoiding these pitfalls dramatically increases the effectiveness of your support and resistance-based strategies.
Trading Strategies Using Support and Resistance
Breakout Strategy
A breakout occurs when price moves decisively above resistance or below support. Traders attempt to capitalize on the momentum that often follows such moves. However, breakouts are notoriously tricky — many are false or short-lived. The key to successful breakout trading lies in confirmation and context. Is the breakout accompanied by a volume surge? Is it occurring during a major news event or in line with the broader trend?
To trade breakouts effectively, use entry triggers like retests (where price breaks a level and returns to it) or candlestick confirmations. Always manage risk tightly, as failed breakouts can quickly reverse and trap traders.
Reversal Strategy
When price approaches a known support or resistance level and shows signs of rejection, reversal strategies come into play. Traders look for price action signals such as pin bars, engulfing candles, or divergences in momentum indicators. The idea is to anticipate a bounce or turnaround before it becomes obvious to the crowd.
Reversals work best at higher timeframe levels and when combined with other elements of confluence. Set tight stop-losses just beyond the level to limit exposure and target the next support or resistance for profit-taking.
Fakeouts and Stop Hunts
Smart money often triggers stop-losses around obvious levels to gather liquidity. These false breakouts, or “fakeouts,” briefly breach support or resistance only to reverse violently. Recognizing these traps can be highly profitable, especially when the fakeout happens in low liquidity conditions or at the end of a trend.
To trade fakeouts, wait for the breakout to fail and price to re-enter the previous range. Enter on confirmation candles and place your stop-loss outside the false break. This strategy requires patience and experience but can offer asymmetric reward-to-risk ratios.
Using Confluence
The most reliable support and resistance trades involve confluence — the overlap of multiple technical factors. For instance, a resistance level aligned with a Fibonacci retracement, a downward trendline, and a bearish RSI divergence is more likely to hold. Confluence builds confidence and filters out weak setups.
Traders who seek confluence improve their selectivity and accuracy. Instead of treating every level as tradable, they focus on zones where multiple forces align. This reduces noise and enhances decision-making under uncertainty.
Support and Resistance Across Markets
Forex
In the forex market, support and resistance levels are particularly relevant due to the high liquidity and tendency for currencies to trend within specific ranges. Major pairs, such as EUR/USD or USD/JPY, often respect key horizontal levels drawn from previous daily or weekly highs/lows. Round numbers also carry added importance due to the clustering of institutional orders.
Stocks
Equities exhibit strong reactions to support and resistance, particularly around earnings reports, psychological prices (e.g., $100, $200), or previous all-time highs. Gaps, volume spikes, and consolidation zones also act as powerful barriers. Additionally, chart patterns like double tops and bottoms often form around these levels.
Crypto
Cryptocurrencies are volatile, but they also exhibit support and resistance levels due to the large presence of retail traders. Key levels are often drawn from major exchange data, prior bull/bear cycle peaks, and round numbers like $10,000 or $50,000 for Bitcoin. Fakeouts are more common due to thin order books and emotional trading.
Indices
Index instruments like the S&P 500 or DAX respect long-term levels due to their role as macroeconomic barometers. Institutional investors, hedge funds, and algo-traders pay close attention to these zones, especially when they coincide with economic data releases or geopolitical developments.
Backtesting and Validating Levels
To build confidence in your support and resistance analysis, backtesting is crucial. This involves looking at how price has behaved around your drawn levels in the past. Did price respect the level multiple times? Did breakouts lead to sustained moves or fakeouts? What was the volume profile like?
Modern platforms like TradingView allow you to replay historical data to simulate trades using your marked levels. Alternatively, record your levels in a trading journal and track how often they hold or fail. Over time, you’ll develop a statistical understanding of which types of zones — and which confluences — work best for your strategy.
Backtesting builds trust in your analysis and trains your pattern recognition. It also helps filter out emotional bias and improve discipline by replacing “feelings” with observable evidence.
Support and Resistance and Risk Management
Support and resistance are not just technical concepts — they are essential tools for risk management. By defining clear levels on your chart, you can anchor your stop-loss and take-profit orders with logic and structure. This is far superior to setting arbitrary risk limits or relying on emotions. Knowing where prices are likely to react gives traders the ability to build trades with favorable risk-reward ratios.
For example, buying at support with a stop just below the zone allows a tight risk margin, while targeting the next resistance maximizes potential reward. Conversely, entering long trades directly into resistance increases risk without justification. Support and resistance should guide both entry and exit points.
Additionally, these levels allow traders to reduce exposure during uncertain periods. If the price is trapped between two strong zones, standing aside can be the best decision. Trading becomes not just about prediction, but precision and protection.
Support and Resistance and Trading Psychology
Perhaps the most underappreciated aspect of support and resistance is their influence on trader psychology. Levels offer a sense of structure in chaotic markets. They give traders a framework to interpret action, build plans, and manage emotions. But they can also become traps when misused.
One of the biggest psychological errors is anchoring — becoming overly attached to a level and refusing to adapt when conditions change. Another is revenge trading after a level “fails,” assuming the market is wrong. In truth, no level is guaranteed to hold. All support and resistance must be treated as zones of potential — not certainty.
The most successful traders utilize support and resistance as flexible guides, rather than rigid rules. They combine them with probabilistic thinking, remain adaptable, and focus on execution rather than prediction. This mindset reduces emotional errors and fosters consistency.
Conclusion
Support and resistance are foundational elements of trading, but their power lies not in their simplicity but in their depth. What may seem like simple lines on a chart actually represent the collective behavior, psychology, and memory of market participants. When drawn and used correctly, these levels offer a reliable roadmap for navigating the markets — highlighting where opportunities may lie and where risks are concentrated.
Throughout this guide, we’ve explored the various dimensions of support and resistance, ranging from static horizontal levels to dynamic zones, from identifying price action to confirming with indicators, and from breakout strategies to reversal setups. We've also tackled the psychological and behavioral biases that can either strengthen or sabotage a trader’s use of these tools.
The journey to mastering support and resistance is iterative. It requires ongoing observation, refinement, and self-awareness. Levels evolve, and so must your approach. Backtesting, journaling, and building confluence are habits that compound over time. And with experience, you begin to see structure where others see randomness, and opportunity where others see noise.
Above all, remember: no level is absolute. The market is fluid, and so must be your interpretation. Respect the zones, manage your risk, trust the process, and let probabilities — not predictions — guide your trades. Support and resistance are not magic, but in the hands of a disciplined trader, they come remarkably close.
Frequently Asked Questions
What timeframes are best for drawing support and resistance?
Higher timeframes like daily and weekly provide stronger, more reliable levels. These should form your core structure, while lower timeframes like 1H or 15M can help refine entries.
Should I use wicks or candle bodies when drawing levels?
Both are useful. Wicks show rejection, while closes reflect consensus. It's best to use a zone that includes both to avoid being too rigid.
How many support and resistance levels should I have on my chart?
Avoid clutter. Focus on 2–3 major levels above and below current price. Too many lines can confuse your analysis and trading decisions.
Can support become resistance and vice versa?
Yes. When price breaks through a level, it often retests it from the other side. This concept is known as role reversal and is widely used by professional traders.
Are support and resistance effective in all markets?
Yes, they apply across forex, stocks, crypto, indices, and more. However, their behavior may differ depending on volatility, liquidity, and market participants.
Note: Any opinions expressed in this article are not to be considered investment advice and are solely those of the authors. Singapore Forex Club is not responsible for any financial decisions based on this article's contents. Readers may use this data for information and educational purposes only.


